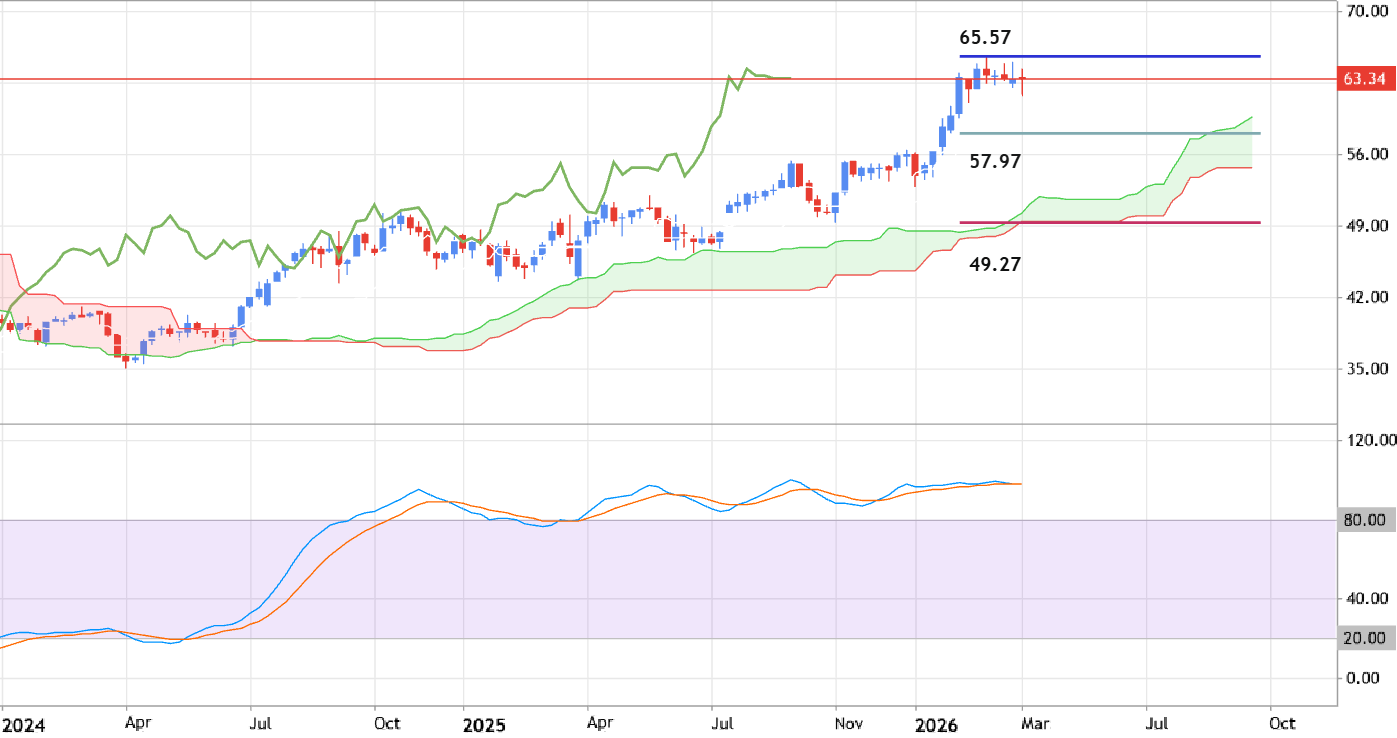
Weekly price is located above Ichimoku cloud in the bullish area of the chart. The price is trying to test the resistance level at 65.57 to above for the primary weekly bullish trend to be continuing. But Stochastic oscillator is indicating the overbought market condition for the price by now, and the nearest support level at 62.38 is the easy to be broken now for example. If the price breaks 65.57 resistance to above so the strong bullish trend will be continuing. If the price crosses 57.97 support to below so the secondary correction within the primary bullish trend will be started with 49.27 level as the weekly bearish reversal target. Alternatively, the price will be on secondary ranging within 57.97/65.57 s/r levels waiting for direction. Trading Summary: ranging within support/resistance channel waiting for direction of the strong trend to be started.
Weekly price is located above Ichimoku cloud in the bullish area of the chart. The price is trying to test the resistance level at 65.57 to above for the primary weekly bullish trend to be continuing. But Stochastic oscillator is indicating the overbought market condition for the price by now, and the nearest support level at 62.38 is the easy to be broken now for example. If the price breaks 65.57 resistance to above so the strong bullish trend will be continuing. If the price crosses 57.97 support to below so the secondary correction within the primary bullish trend will be started with 49.27 level as the weekly bearish reversal target. Alternatively, the price will be on secondary ranging within 57.97/65.57 s/r levels waiting for direction. Trading Summary: ranging within support/resistance channel waiting for direction of the strong trend to be started.


Nouveau commentaire
Weekly price is located above Ichimoku cloud in the bullish area of the chart. The price is trying to test the resistance level at 65.57 to above for the primary weekly bullish trend to be continuing. But Stochastic oscillator is indicating the overbought market condition for the price by now, and the nearest support level at 62.38 is the easy to be broken now for example. If the price breaks 65.57 resistance to above so the strong bullish trend will be continuing. If the price crosses 57.97 support to below so the secondary correction within the primary bullish trend will be started with 49.27 level as the weekly bearish reversal target. Alternatively, the price will be on secondary ranging within 57.97/65.57 s/r levels waiting for direction. Trading Summary: ranging within support/resistance channel waiting for direction of the strong trend to be started.
Nice work
test comment
test reply