
The financial industry routinely uses the headline S&P 500 Index ($SPX), as tracked by the SPDR S&P 500 (SPY), to paint a picture of enduring market health. The mainstream narrative suggests that as long as the main averages hold near high ground, the broader equity market is functioning perfectly. I think that’s faulty logic.
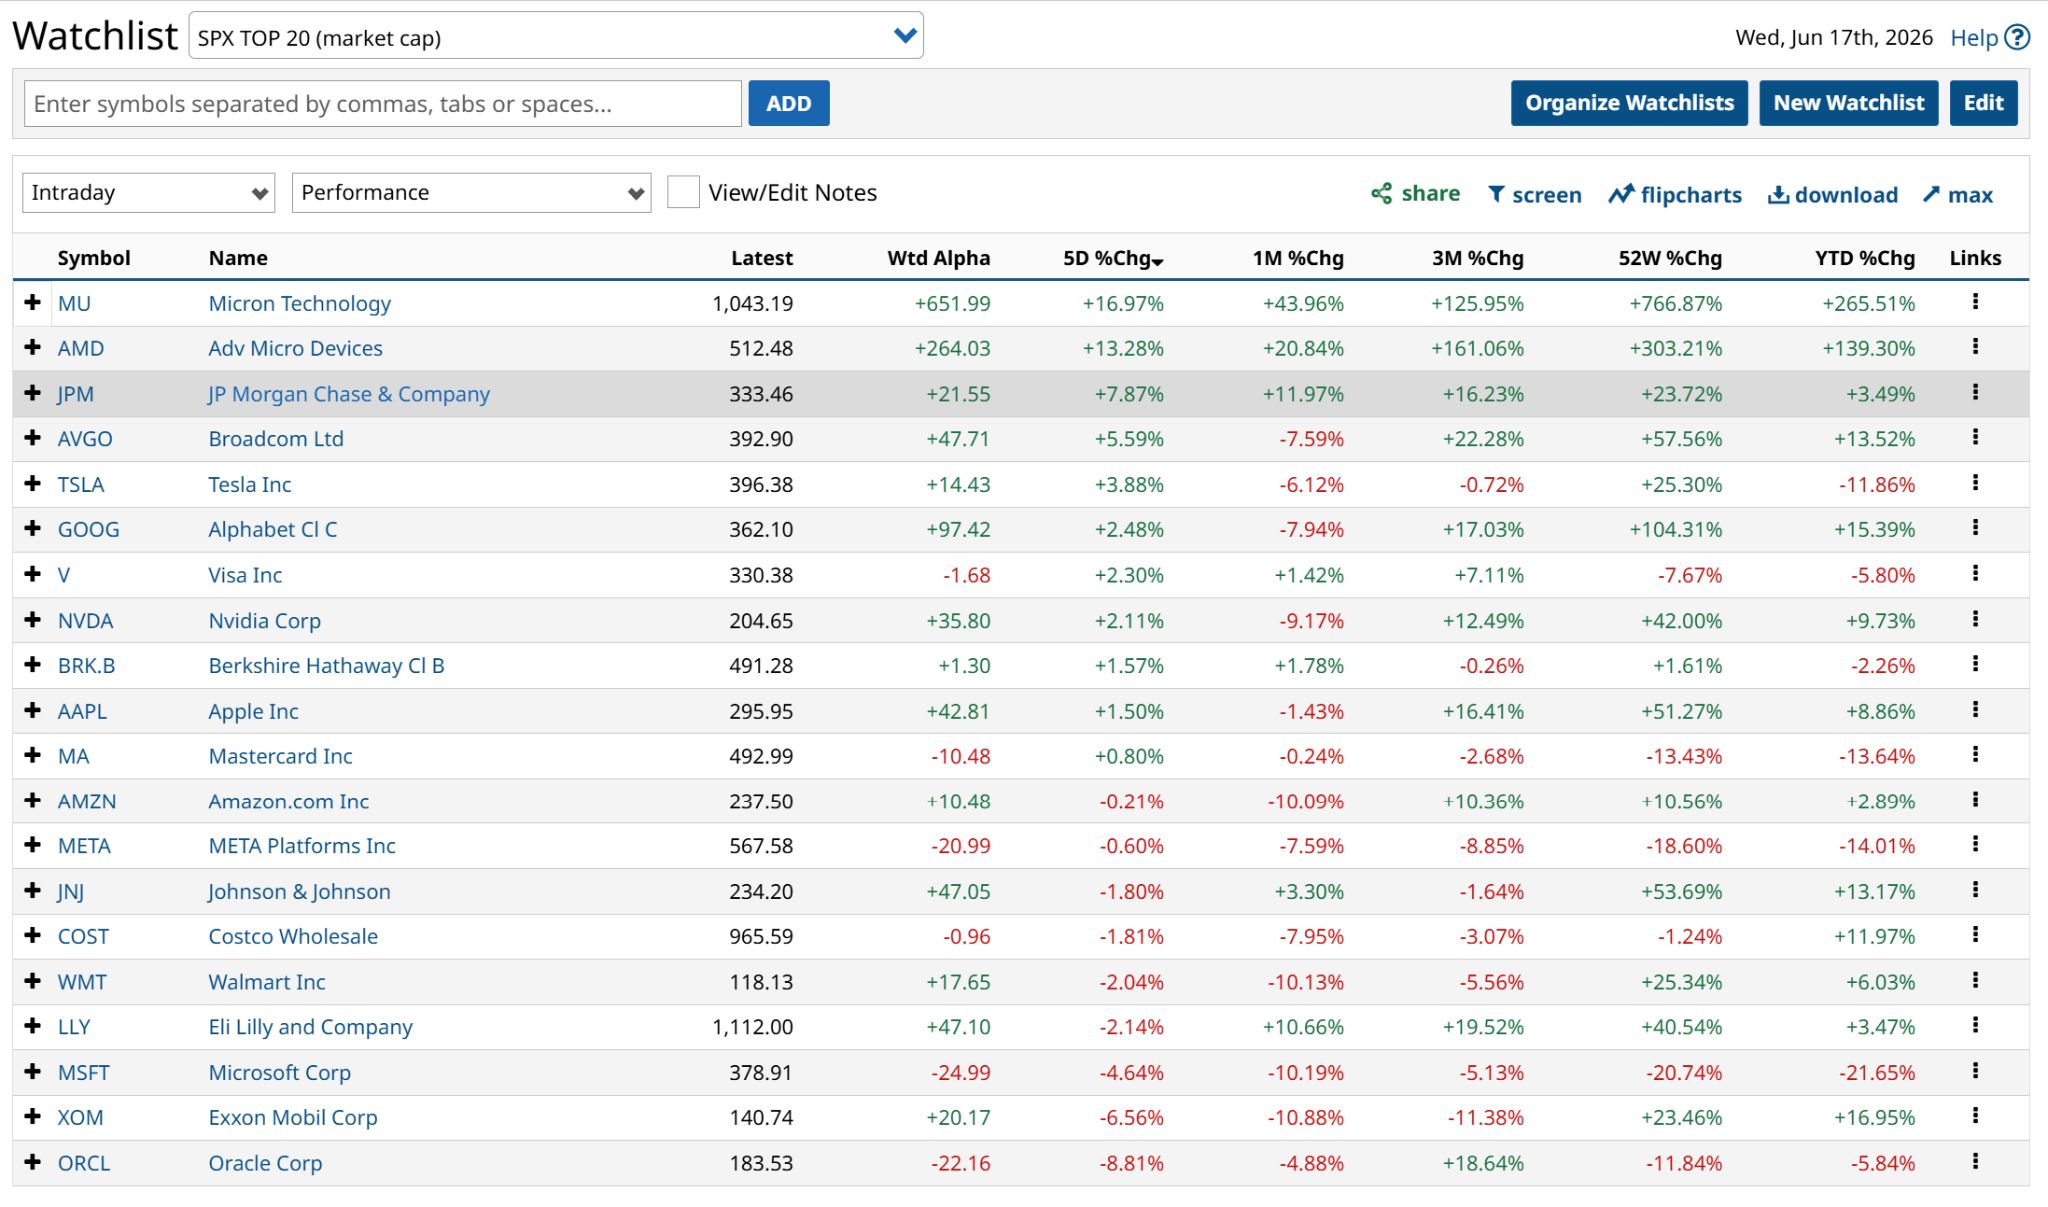
I pulled up this chart of 20 of the biggest stocks in the U.S. market. I’ve excluded rookie SpaceX (SPCX), since the goal here is to see how much performance breadth there is among these established public companies.
More Yield, Less Trap: Sign up free to get Barchart’s daily Dividend Investor newsletter straight to your inbox.
 www.barchart.com
 Here is what I’m looking at across the trailing time frames listed across the top: How many of these 20 stocks are up versus down?
I’ll explain why after I show you the summary figures.
Read more from Barchart:
AI is “one of the largest industries ever” ...and it’s already disrupting this $1T market. The next AI wave won’t look like chatbots. It will look like this.How many stocks on this list are up?
The past 52 weeks? 14.
Year to date? 13.
The past 3 months? 11.
The past 1 month? 7
I see where this is going. Do you?
I do not think this is simply some quantitative trick. It is one of many indicators that signal to me that the S&P 500’s leaders are not well. That matters because since the AI-fueled rally started in late 2022, the market has been dominated by the very largest stocks. And like a baby bird breaking through an egg with its beak, so too is the market cracking before our eyes.
This could be as simple as a shift in leadership, but I do not think that’s happening. Not based on what I found after charting every stock in the S&P 500 earlier this week.
There are some positive chart patterns. But not enough of them, and not in the stocks that count. Namely, these 20, which make up nearly 50% of the full S&P 500 Index by weight. If nearly two-thirds of these giants are steadily fading, the math just does not work.
A Market Infection Is Starting to Spread
For a while now, market breadth has been severely deteriorating below the surface, with nearly half of the largest U.S. equities failing to outperform simple cash proxies over a multi-year period.
Now, the situation has taken a critical turn. The deterioration is no longer confined to the bottom 450 stocks of the index. It has aggressively penetrated the top of the food chain.
The Barchart watchlists I maintain can be easily replicated. You can even take ETFs like the iShares S&P 100 ETF (OEF), which tracks the top 100 stocks, or the Invesco S&P 500 Top 50 ETF (XLG), which tracks the top 50 stocks, and create a handy watchlist from them. That’s what I did a while back using the iShares Top 20 U.S. Stocks ETF (TOPT) to get the 20 largest stocks within the S&P 500.
Watchlists like that, studied regularly to look for circumstantial evidence like what I showed above, can serve as the ultimate cheat sheet for investors. They should not be used in isolation, but as additional, and perhaps powerful pieces of evidence on the “bear” side of the ledger. This image is a stark, data-driven look at how severely market participation has narrowed, proving that fragmentation is taking place even among the market’s elite names.
The only reason the headline index looks stable is due to an extraordinarily tight, hyper-concentrated group of semiconductor and hardware heavyweights. Micron Technology (MU) is sitting on an eye-popping 265% YTD gain, while Advanced Micro Devices (AMD) shows a 139% surge over that same period.
These few names are single-handedly pulling the cap-weighted averages upward. Heck, just look at the weighted alpha column! I do not think I’ve ever seen a spread like that. Except maybe at my friend’s country club brunch on a Sunday.
Now, look down the rest of the list. Outside of the semiconductor pocket, the largest businesses in the world are bleeding capital over the short and intermediate term. Even many of the Magnificent Seven stocks.
When an index relies entirely on two or three chipmakers to maintain its headline score while core enterprise software, consumer staples, and energy giants are simultaneously shedding value, the internal structure is profoundly weak.
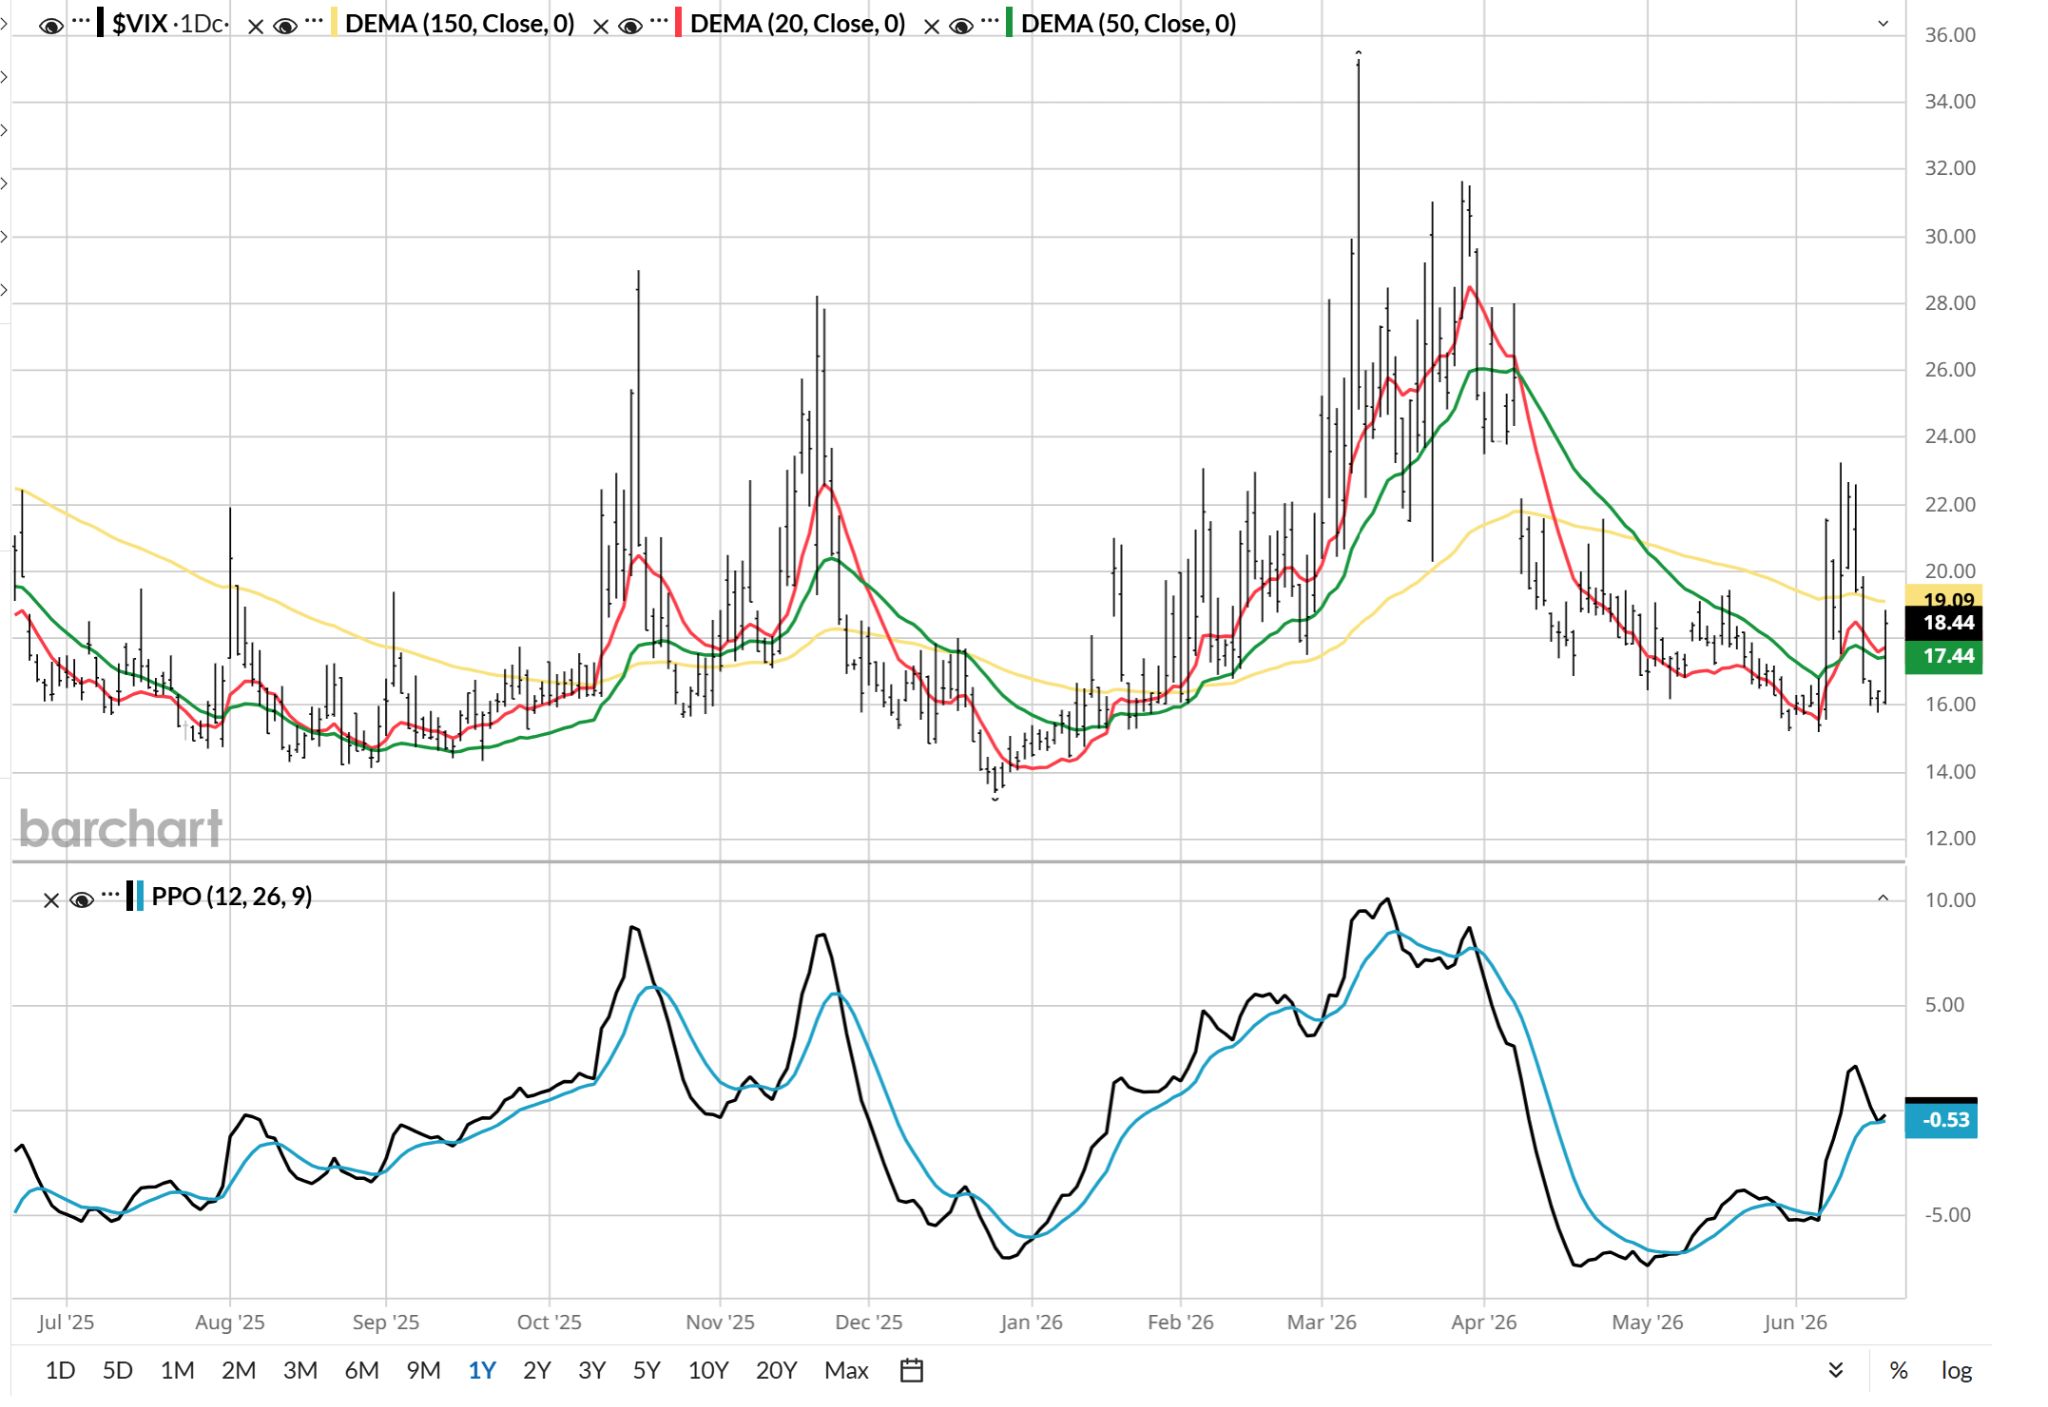
I would normally recommend volatility ETFs like the ProShares VIX Short-Term Futures ETF (VIXY), in order to be ready for a sudden rolling over of the market.
However, the CBOE Volatility Index ($VIX) is still stuck in its own little trading range. So I am not counting on that route beyond the modest position I have in my 10-ETF model portfolio.
 www.barchart.com
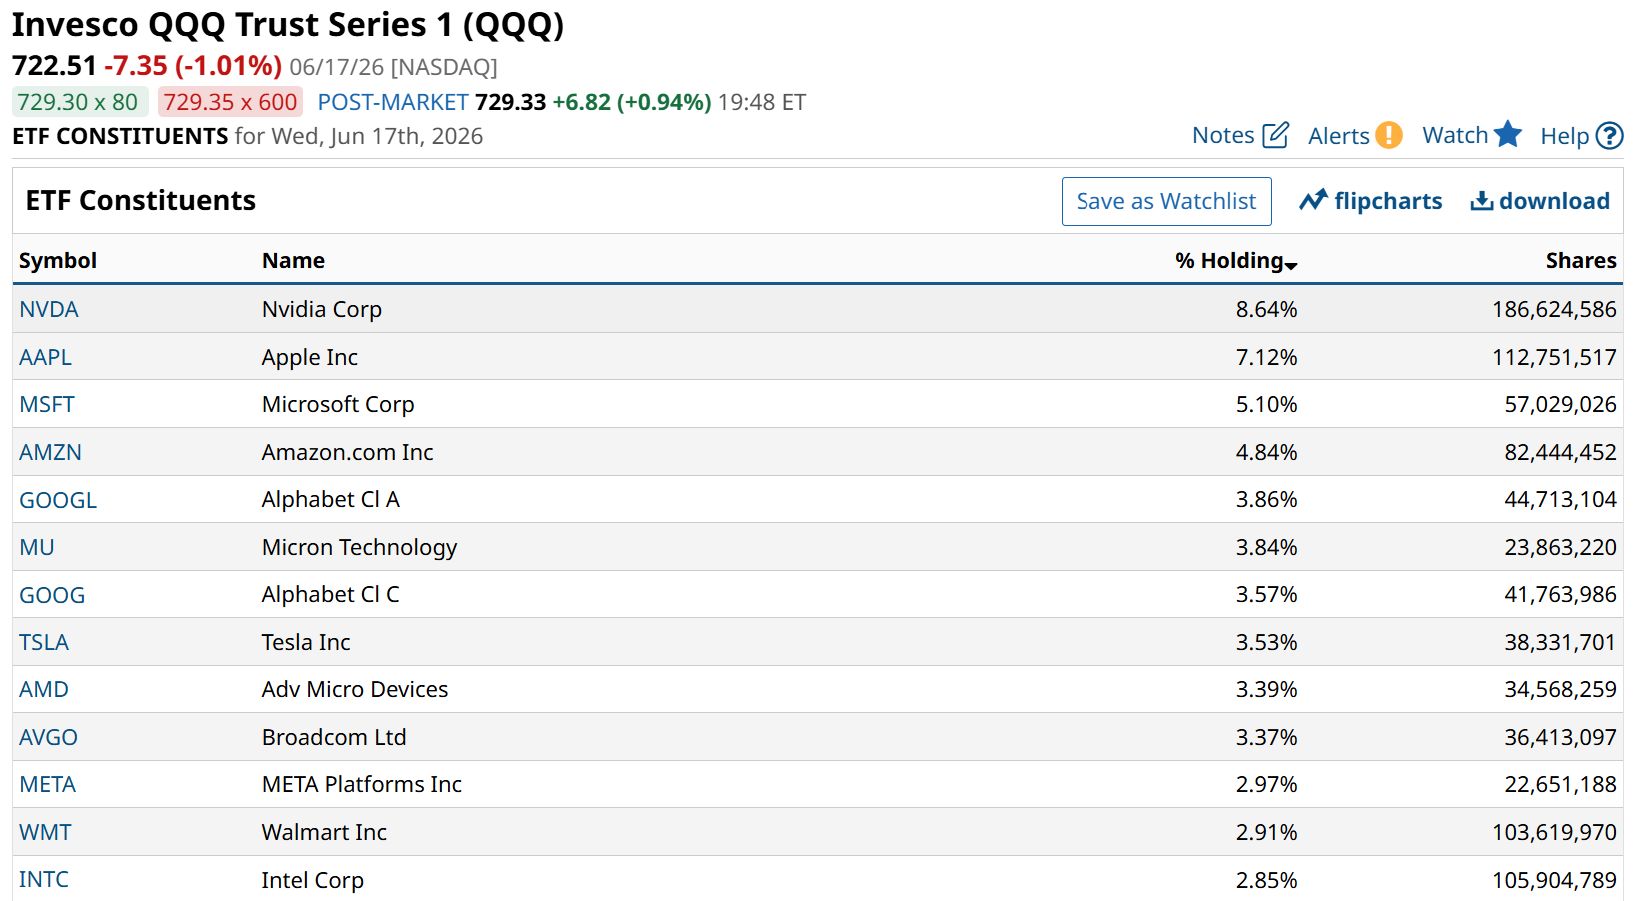
 I am looking to be a bit more focused in my portfolio hedging, using inverse ETFs like the ProShares Short QQQ (PSQ), which shorts the Nasdaq-100 Index ($IUXX). Here’s the top holdings of that index – essentially the biggest chunk of the top-20 list above.
 www.barchart.com
 As I said above, take this as another piece of evidence. One that reminds us that the structure of the S&P 500 is now its biggest risk. Many great companies can become very poor stocks in a market like this. So account for that in your ongoing portfolio planning so you can stay in control of your own wealth.
Rob Isbitts created the ROAR Score, based on his 40+ years of technical analysis experience. ROAR helps DIY investors manage risk and create their own portfolios. For Rob’s written research, check out ETFYourself.com.
On the date of publication, Rob Isbitts did not have (either directly or indirectly) positions in any of the securities mentioned in this article. All information and data in this article is solely for informational purposes. For more information please view the Barchart Disclosure Policy here.
More news from Barchart
Crash Warning: Barchart’s Ultimate Trader Cheat Sheet Alerted Me That Even Mega-Cap Tech Stocks Are Starting to Deteriorate Microsoft vs. Nvidia: Which AI Giant Is the Better Dividend Stock for the Long Haul? Billionaire Barry Diller Is Making a $18M Bet on MGM Stock. Here’s What It Means for Investors. How to Hunt for Mega-Cap Value After the SpaceX IPO