


Baltimore, Maryland-based T. Rowe Price Group, Inc. (TROW) is a publicly owned investment manager that provides its services to individuals, institutional investors, retirement plans, financial intermediaries, and institutions. Valued at $22.7 billion by market cap, the company provides investment advisory services and manages a broad range of U.S. and international stock, blended asset, bond, and money market mutual funds and other investment portfolios.
Companies worth $10 billion or more are generally described as “large-cap stocks,” and TROW perfectly fits that description, with its market cap exceeding this mark, underscoring its size, influence, and dominance within the asset management industry. TROW derives its core competitive strengths from its robust brand equity, extensive proprietary research capabilities, and industry-leading position in target-date retirement products.
More Top Stocks Daily: Go behind Wall Street’s hottest headlines with Barchart’s Active Investor newsletter.
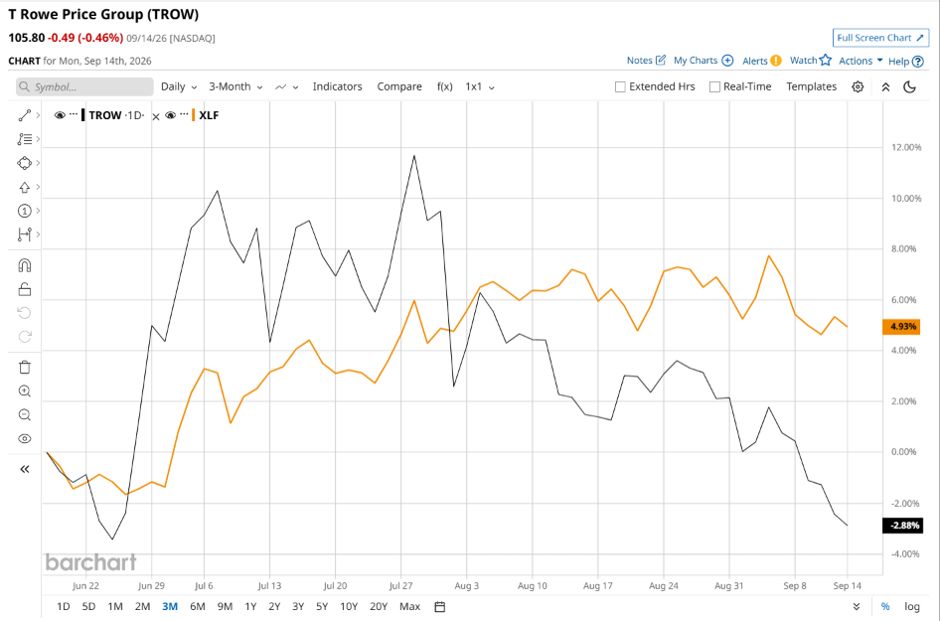
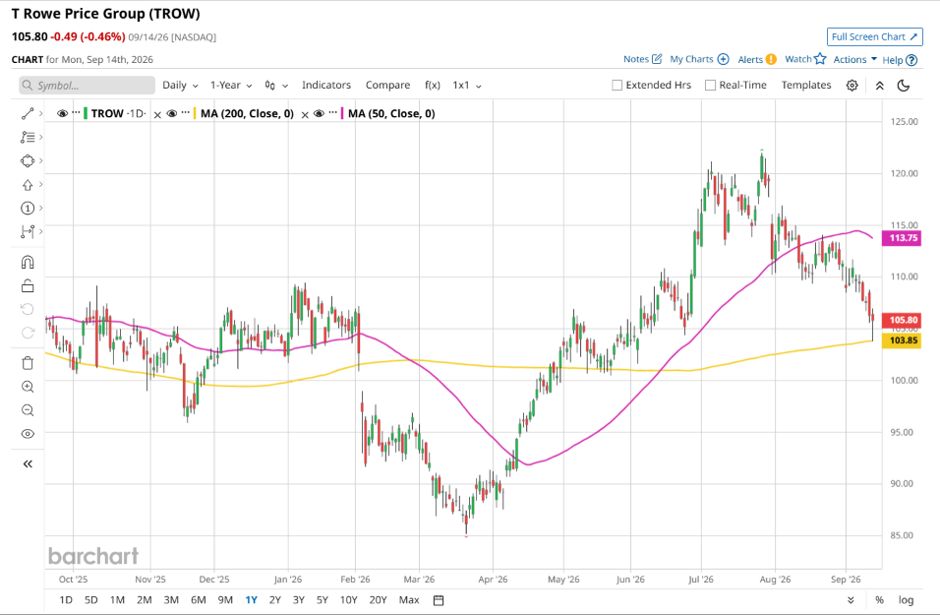
Despite its notable strength, TROW slipped 13.3% from its 52-week high of $122, achieved on Jul. 28. Over the past three months, TROW stock declined 3.5%, underperforming the State Street Financial Select Sector SPDR ETF’s (XLF) 6.9% gains during the same time frame.
 www.barchart.com
Shares of TROW rose 3.3% on a YTD basis and climbed marginally over the past 52 weeks, underperforming XLF’s YTD gains of 4.1% and 6% returns over the last year.
To confirm the bullish trend, TROW has been trading above its 200-day moving average since late April, with slight fluctuations. However, the stock is trading below its 50-day moving average since mid-August, experiencing minor fluctuations.
 www.barchart.com
TROW has underperformed primarily due to persistent net asset outflows and structural pressure on active investment management fees. As an active manager heavily weighted in mutual funds, the firm continues to face secular industry headwinds from investors shifting capital toward lower-cost passive index products and ETFs. Although TROW has expanded its active ETF offerings, pursued strategic acquisitions, and integrated AI capabilities into its investment process, these initiatives have yet to fully offset revenue compression from client redemptions.
On Jul. 31, TROW shares closed down more than 6% after reporting its Q2 results. Its adjusted EPS of $2.57 topped Wall Street expectations of $2.52. The company’s revenue was $1.91 billion, missing Wall Street forecasts of $1.92 billion.
In the competitive arena of asset management, Franklin Templeton Inc. (BEN) has taken the lead over the stock, showing resilience with a 40.1% uptick on a YTD basis and 35.8% gains over the past 52 weeks.
Wall Street analysts are reasonably bearish on TROW’s prospects. The stock has a consensus “Moderate Sell” rating from the 14 analysts covering it, and the mean price target of $107.92 suggests a potential upside of 2% from current price levels.
On the date of publication, Neha Panjwani did not have (either directly or indirectly) positions in any of the securities mentioned in this article. All information and data in this article is solely for informational purposes. For more information please view the Barchart Disclosure Policy here.