


Meta Platforms (META) is a transformative, albeit controversial, company. And despite its recent stealth rally, I see a technical pattern developing that makes me more prone to short META stock than buy it here.
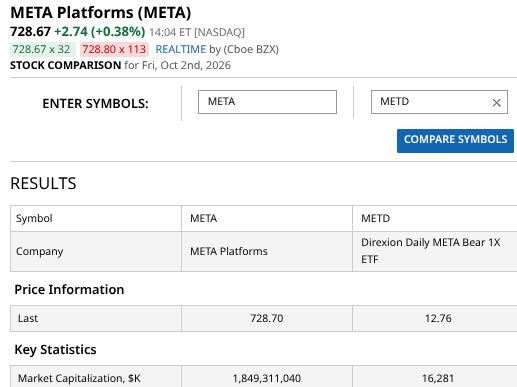
Spoiler alert! There’s an easy way to do that through ETFs designed to move in the opposite direction of the underlying stock. So in the case of META, the Direxion Daily META Bear 1X ETF (METD) moves in reverse order.
More Yield, Less Trap: Sign up free to get Barchart’s daily Dividend Investor newsletter straight to your inbox.
 www.barchart.com
 For those looking to “trade the fade” here, that little ETF, all $16 million in assets of it, is one to consider. But it’s important to do your homework first.
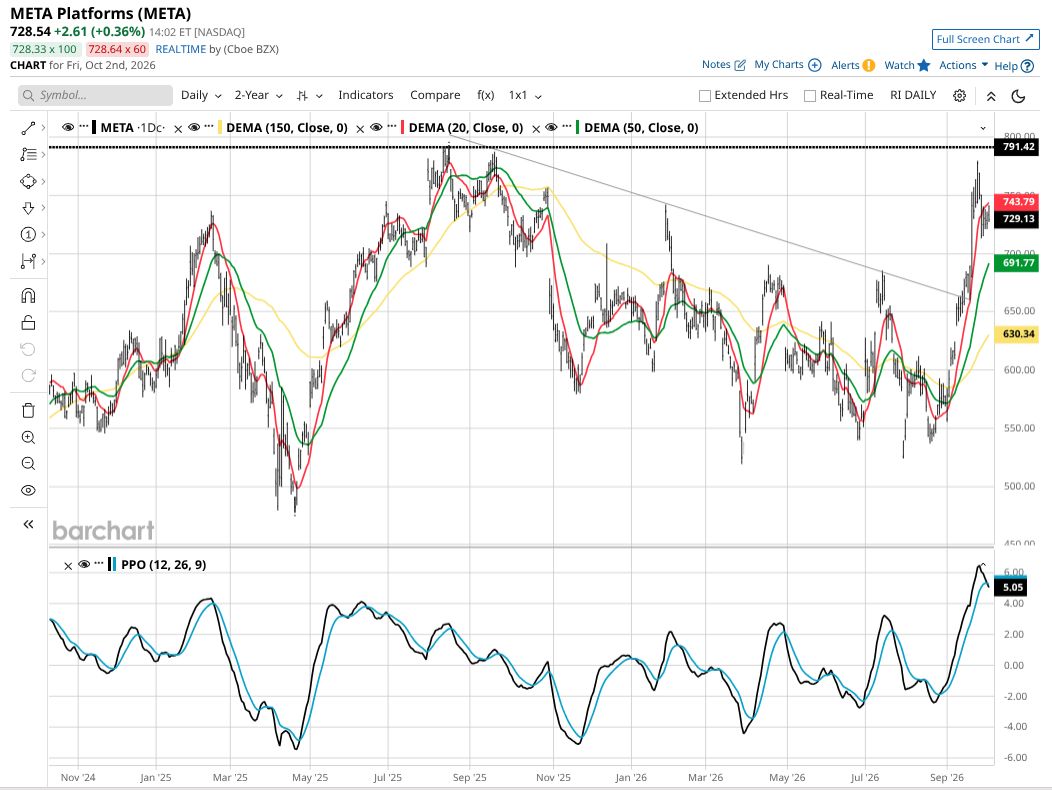
Before I can even consider METD, versus buying puts or simply reducing my META position size, I need to have a thought-out rationale. Mine is primarily technical.
 www.barchart.com
 Let’s take an example of 1000 shares of METD, which at a recent price of $12.50 would cost $12,500. For every 1% META moves up, METD would lose around $125. So if META sprinted up 20% as it did recently, METD is going to drop roughly $2,500.
If I’m bearish on META but wish to keep some of my stock, I could just sell part of it. That reduces my “exposure” to this potential topping pattern.
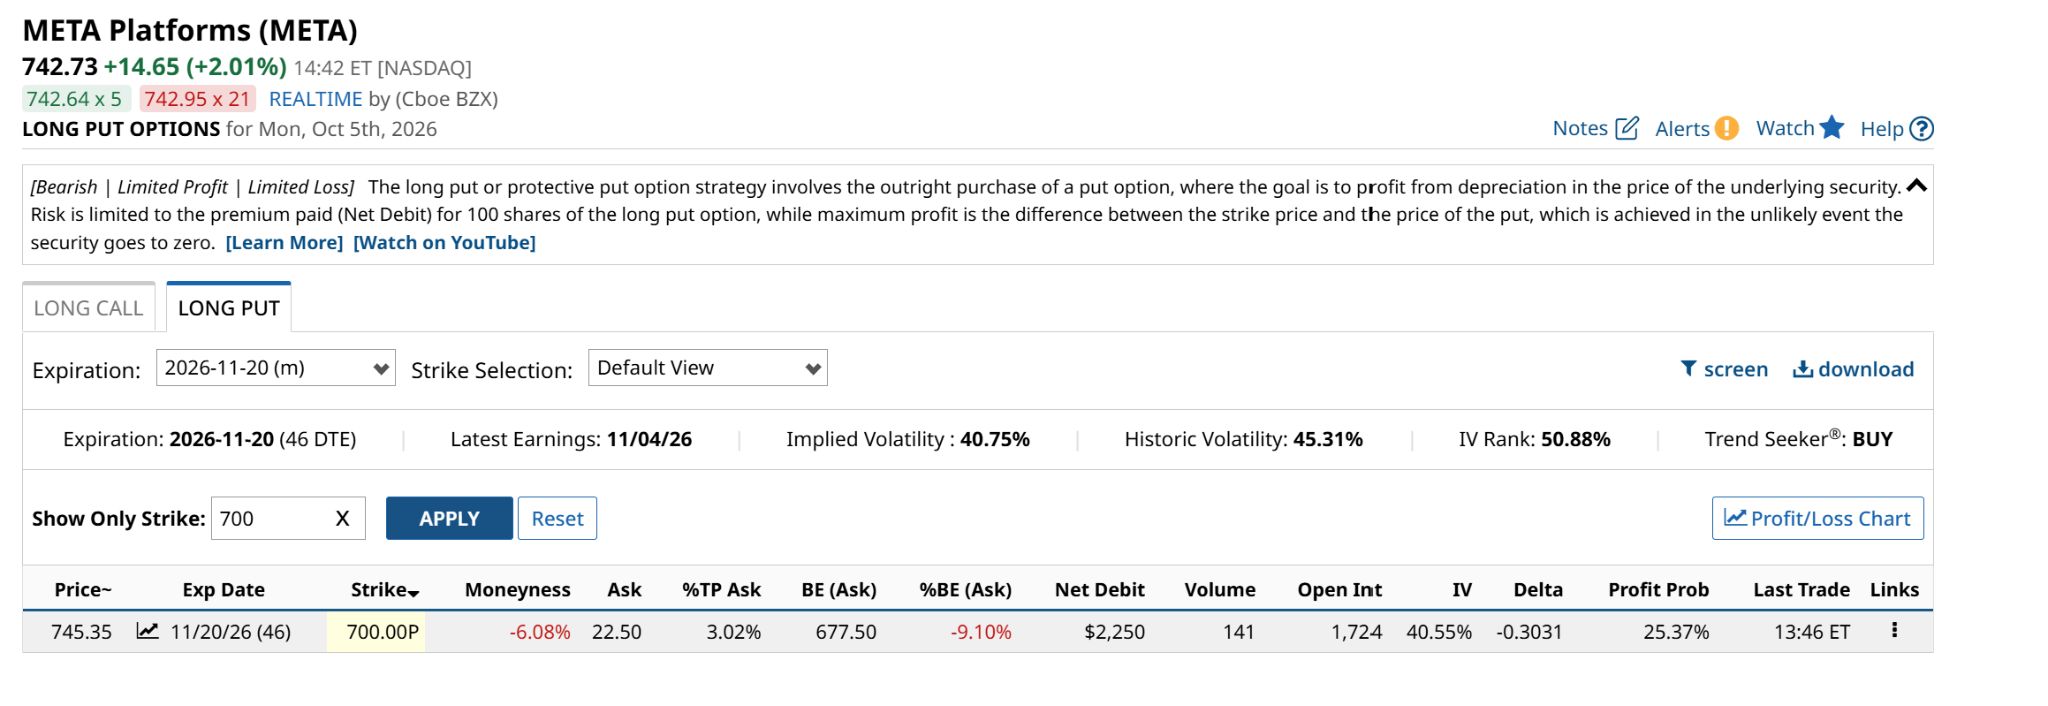
I could try to buy puts on META instead of considering the offsetting inverse ETF. However, the math gets tricky, since META is a $750 stock, and every put option represents 100 shares. So that’s $75,000 of META. In such a case, I’d simply reduce my position size, rather than finagle my way through finding a good fit in the options.
 www.barchart.com
 Still, everyone’s situation is different. If you owned META the past 10 years in a taxable account, and are in a high tax bracket, taking that tax burden is not very attractive. That’s where owning METD alongside META temporarily, despite it seeming illogical and redundant, does negate the impact of a full-fledged slide in META.
How Did We Get Here With META?
Traders and investors love a good momentum story, and META has provided plenty of headline fireworks. That’s a pretty clean trading range from $500 to $750. Market pundits are once again declaring an AI-driven breakout is ahead. But until that happens, META is simply at the top of a trading range.
If you step back from the daily hype machine and look at the chart over a 12-18-month horizon, a very different picture emerges. If you bought META in mid-February 2025, some 20 months ago, you would be break-even now. That’s a long time to deal with a “dead money” situation, no matter how much of a leader the business is.
For buy-and-hold investors expecting seamless compounding, META might be setting up for a repeat performance: a lot of noise, extreme price swings, and ultimate round-trip stagnation.
META’s ‘Surge to Nowhere’
A 30%-40% price surge over a two-month period feels exhilarating while you’re riding it. But context is everything in active risk management. When you track META’s journey over the past year, these explosive rallies have consistently served as range retests rather than structural breakouts.
Buying at the top of a well-defined 12-month range is one of the most dangerous habits in retail investing. You are paying a peak multiple at the exact moment the risk-reward ratio flips against you. Can it work out? Yes. Is it a high-risk proposition, in a market that likely offers better tradeoffs elsewhere? Also yes!
The fundamental catalyst behind META’s range-bound behavior is the sheer scale of its AI infrastructure efforts.
META is pouring tens of billions of dollars annually into data centers, custom silicon, and AI compute capacity. While long-term bulls point to user engagement across Instagram and WhatsApp, those massive capex commitments act as a persistent weight on free cash flow generation.
When META trades near $550, the market is willing to price in its core advertising cash cow. But when the stock stretches toward $770, valuation multiples expand to levels that lead one to pull forward a lot of demand. It is an age-old issue. Thus, the risk amid a remarkably fast and fierce upward price move.
Until META demonstrates a clear, sustained breakthrough that justifies a permanent multiple expansion, I am going to treat rallies with extreme skepticism. In a market where 5% risk-free yield is readily available, taking on 30% downside risk in a mega-cap tech stock is a trade I simply don’t need to make.
My proprietary ROAR Score analysis of META confirms this. A score of 50 reminds me that this is not a done deal either way. What I flag here is that ROAR kept me out of META (red zone) until it showed more than a brief pop back in August.
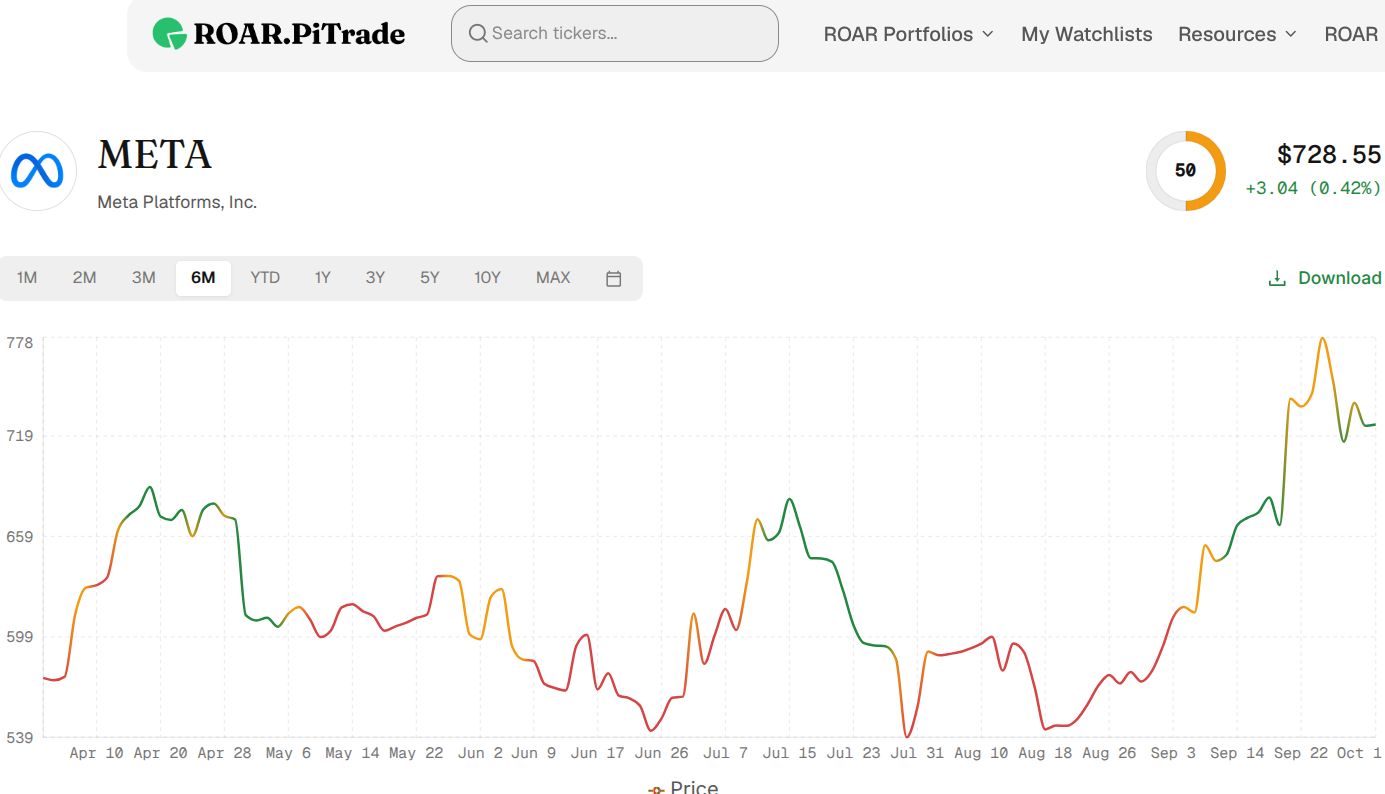 Chart courtesy of Rob Isbitts via ROAR.PiTrade.com
 The Long and Short of It?
META is one of many stocks I am looking at in a similar manner.Frankly, I feel like I’m on a path toward adding a model portfolio to my arsenal that looks at a range of stocks with inverse ETFs, and deciding between “long, inverse, no position” at any point in time.
I think the markets now give us this ability to embrace long-short investing without a hedge fund charging 2% plus 20% of the profits.
Rob Isbitts is a semi-retired CIO, former fiduciary investment advisor, and Barchart columnist. Check out his other work at ETFYourself.com (featuring the Fresh Charts weekly trading post), and ROAR.PiTrade.com, helping investors to better-manage their own portfolios.
On the date of publication, Rob Isbitts did not have (either directly or indirectly) positions in any of the securities mentioned in this article. All information and data in this article is solely for informational purposes. For more information please view the Barchart Disclosure Policy here.
More news from Barchart
Here’s Why I’m Very Skeptical of the META Stock Rally (And You Should Be Too) This ETF is Soaring as the Bond Market Gets Crushed. What Investors Need to Know Before Buying. SPY vs. SPY: This Chart Says We’re Already in a Market Correction. Here’s My Trade Plan. Trying to Pick Individual Stocks to Buy Is the Most Pointless Thing Investors Can Do Now