


Airbnb Inc. (ABNB) delivered strong Q3 revenue and free cash flow (FCF) on Nov. 5, with higher FCF margins. ABNB stock soared over 11% on Friday. Is it too late to get in? This article covers some ABNB plays.
ABNB was up $20 in midday trading on Friday, Nov. 6, at $189.99. That's up from $164.39 on Oct. 30, and a recent low of $149.58 on Sept. 23. But can it move significantly higher?
Can’t Get Enough Options?: Join the list for Barchart’s daily unusual options report, delivered free.
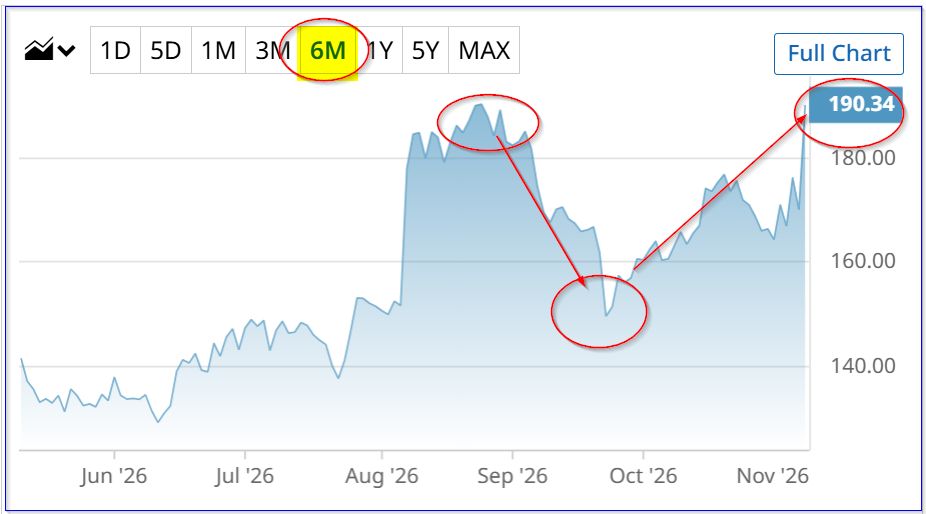 ABNB stock - last 6 months - Barchart - Friday, Nov. 6, 2026
Analysts think so. The average price target (PT) from 44 analysts surveyed by Yahoo! Finance is $200.40. And Barchart's mean survey PT is $199.84, both higher than Friday's close.
Let's analyze why
Strong FCF and Revenue Forecasts
Airbnb said its gross booking value rose 21% YoY in Q3 and revenue grew 19%. Moreover, Q3 free cash flow (FCF) gained 32.8% to $1.4 billion with a 29% FCF margin (29% last year).
Moreover, its trailing 12-month (TTM) FCF rose 20.4% to $4.9 billion, representing 35% of revenue (38% last year). These figures are on page 14 of its shareholder letter.
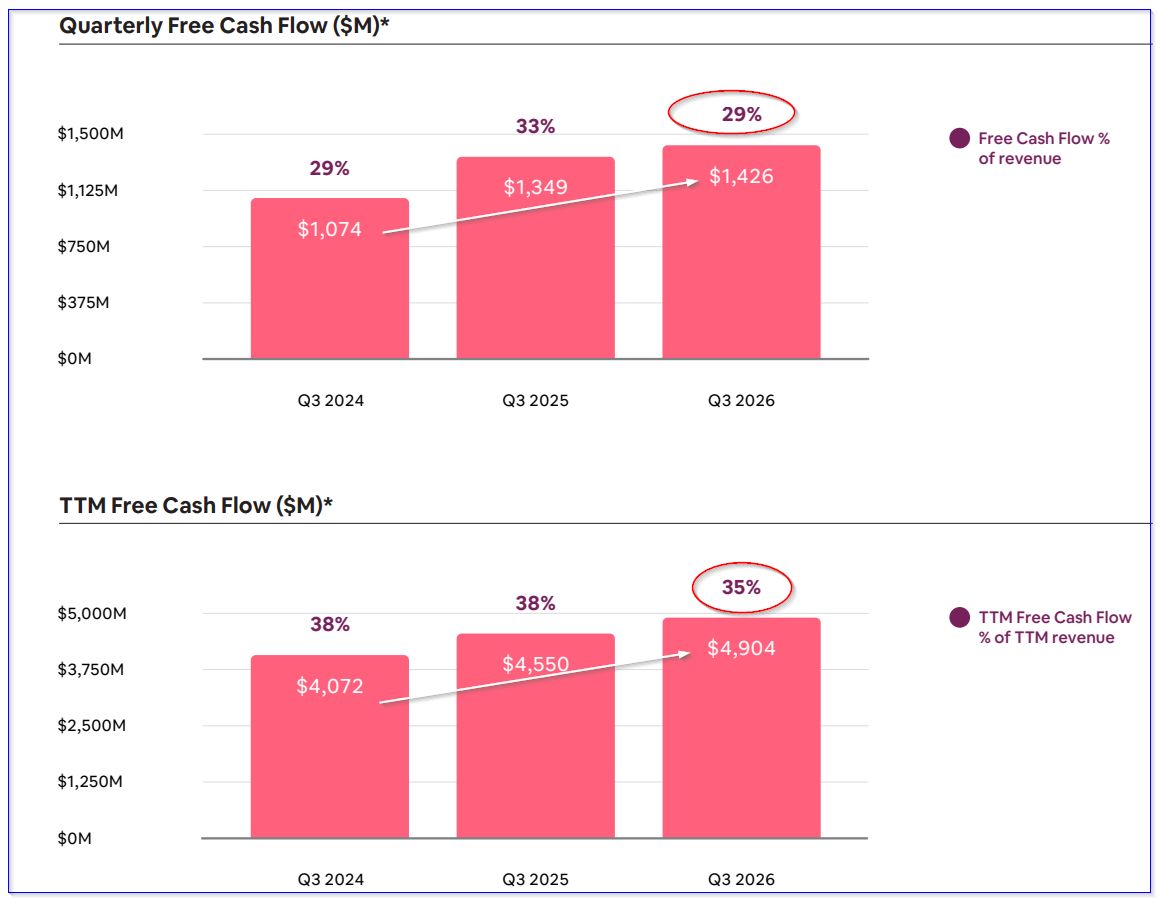 ABNB FCF and FCF margins - page 14 of Q3 shareholder letter
This implies that as Airbnb's revenue rises, the company's strong FCF margins could keep pushing FCF even higher.
For example, analysts expect revenue to rise 7.75% from $14.18 billion in 2026 to $15.28 billion in 2027.
So, for example, if the company maintains a 35% to 38% FCF margin performance (say 36.5%), FCF could exceed $5.5 billion:
$15.28b x 0.365 = $5.5772 billion FCF
That's +13.7% above the Q3 TTM FCF of $4.904 billion (see above). In other words, its valuation should rise. But by how much?
Fair Market Value for ABNB Stock
Over the last 5 years, Seeking Alpha says the average price/cash flow multiple has been over 24.2 times (i.e., a 4.1% FCF yield). So, ABNB could be worth $140 billion in the next year:
$5.5772 / 0.041 = $140.78 billion fair market value (FMV)
That is over $27.4 billion above its present $113.375 billion market cap, according to Yahoo! Finance. In other words, its PT is 24.2% higher:
$189.99 x 1.242 = $236 PT
However, this assumes revenue will rise 7.75% next year, and its average FCF margin will be 36.5%. If figures come in lower than this, ABNB won't be worth 24% more.
And, as always, there is no guarantee the stock will rise to exactly its underlying value. It could underperform or overshoot.
As a result, one way to conservatively play ABNB is to sell out-of-the-money (OTM) puts in nearby expiry periods.
Shorting OTM ABNB Puts
For example, the Dec. 11 expiry period shows that the $175.00 put strike price has a midpoint premium of $3.25. That strike is 7.9% below Friday's price, so it is well out-of-the-money (OTM) - i.e., they won't be assigned to the short seller without an 8% drop.
As a result, the investor who enters an order to “Sell to Open” 1 put collects $325 after posting $17,500 in collateral. That works out to an expected yield (assuming it expires OTM and worthless) of 1.857% (i.e., $325/$17,500) for the month.
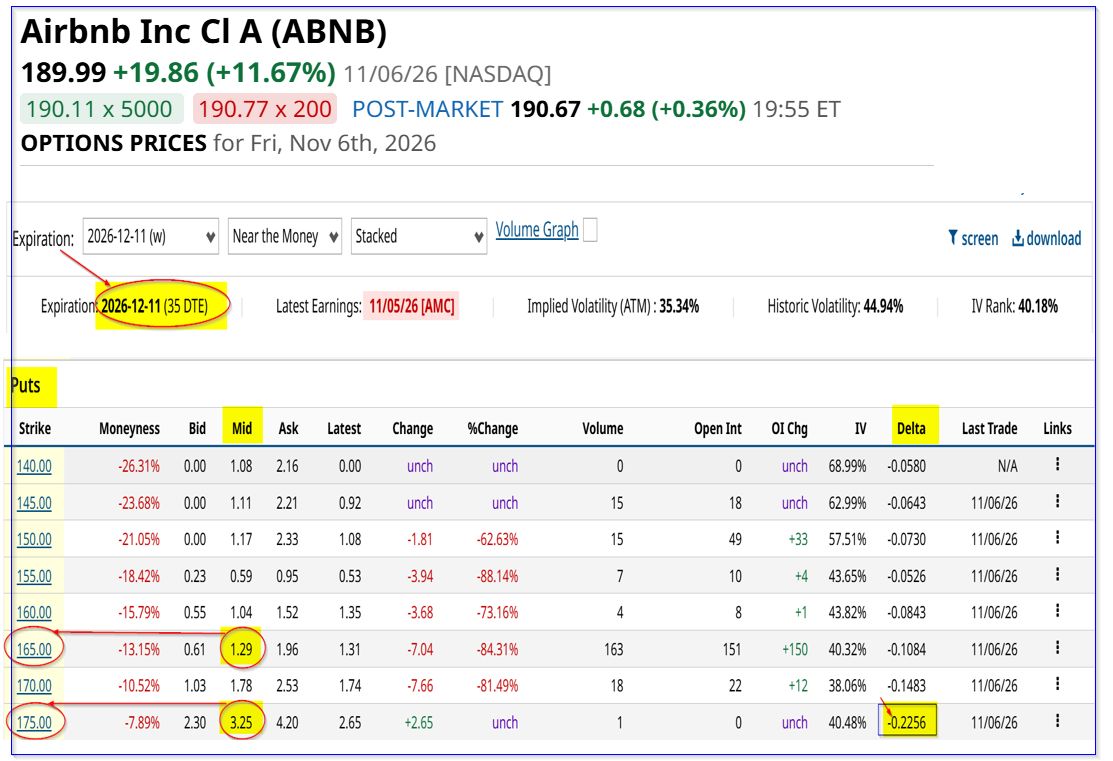 ABNB puts expiring Dec. 11 - Barchart - As of Nov. 6, 2026
Moreover, even if ABNB falls to $175.00 by Dec. 11, the investor has a lower breakeven buy-in for 100 shares (per contract):
$17,500 - $325 = $17,175, i.e., $171.75 p/sh.
That's almost 10% (-9.6% OTM) lower than Friday's price, so it provides a good potential buy-in point.
Note also that there is a good likelihood that the stock will stay out-of-the-money - the delta ratio is -0.2256, implying almost a 78% chance that ABNB won't drop to $175.00
As a result, if an investor repeats this play for three to six months, the expected return (ER) is between 5.571% and 11.142% (assuming the same short-put yields can be made each month).
Put Credit Spread Play
For investors willing to take on more risk (for higher returns), doing a put credit spread is attractive. This works by adding a put purchase to the short-put play. The put buy is at a lower strike price, providing less income, but the collateral required is much lower.
For example, if an investor bought the $165.00 put with the proceeds from the short sale of the $175 put, the net credit is:
$325 - $129 = $196
However, the brokerage firm will require only $1,000 in collateral (i.e., $275-$265 x 100). So, the total at-risk loss is $1,000 - $196, or $804. However, the ER is very high:
$196 / $804 -1 = 24.38%
Moreover, by doing just 2 put credit spreads for $2,000 in collateral, the investor can collect more than the short-put play: $392 ($196 x 2) vs. $325 (short-put).
But the $804 put credit spread collateral is less than 5% of the $17,175 net collateral requirement from the short-put play.
Nevertheless, the risk is much higher. If ABNB falls to $165.00, the put credit spread loses 100% of the collateral.
The bottom line is that, if ABNB stays over $175.00, these two plays are attractive investments.
On the date of publication, Mark R. Hake, CFA did not directly have a position in any of the securities mentioned in this article. All information and data in this article is solely for informational purposes. For more information please view the Barchart Disclosure Policy here.
More news from Barchart
Airbnb Soars Over 11% After Strong FCF Results - What's the Best ABNB Play Now? Nasdaq Rout Gives Way to Unusual Options Activity and Bullish Bets on Nvidia, AT&T and Alphabet Stocks Uber Technologies Delivers Strong FCF - What's the Best UBER Play? Unusual Options Activity in Airline Stocks Shows Optimism Building: Go Deeper into the Trades