


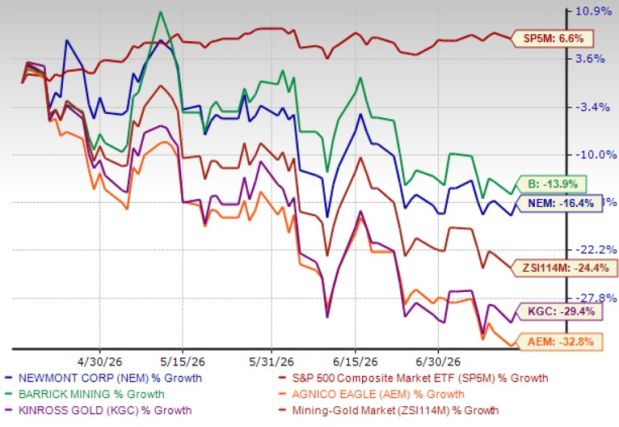
Newmont Corporation's NEM shares have lost 16.4% in the past three months, reflecting the sharp decline in gold prices on inflation worries stemming from the Middle East tensions, a stronger U.S. dollar and expectations of higher interest rates.
NEM stock has outperformed the Zacks Mining – Gold industry’s 24.4% fall while underperforming the S&P 500’s 6.6% increase. Among its gold mining peers, Barrick Mining Corporation B, Agnico Eagle Mines Limited AEM and Kinross Gold Corporation KGC have lost 13.9%, 32.8% and 29.4%, respectively, over the same period.
NEM’s 3-month Price Performance
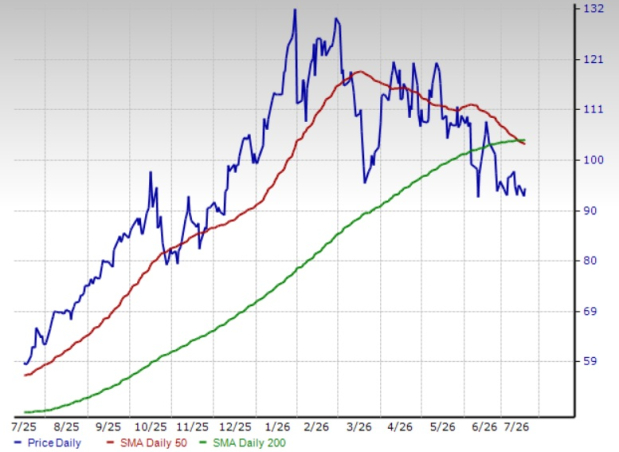
The NEM stock slipped below its 200-day simple moving average (SMA) on June 22, 2026. It is also currently trading below its 50-day SMA. The 50-day SMA is reading lower than the 200-day SMA, following a death crossover on July 9, 2026, signaling a bearish trend.
NEM Stock Trades Below 50-Day SMA
Let’s take a look at NEM’s fundamentals to analyze the stock better.
NEM Poised for Growth on Key Projects & Portfolio Actions
Newmont continues to invest in growth projects in a calculated manner. The company is pursuing several projects, including the Cadia Panel Caves and Tanami Expansion 2 in Australia. These projects should expand Newmont’s production capacity and extend mine life, driving revenues and profits.
In October 2025, NEM achieved a significant milestone at Ahafo North. It achieved commercial production at the project, which followed the first gold pour in September 2025. Ahafo North is expected to produce between 275,000 and 325,000 ounces of gold annually over an estimated mine life of 13 years. Output is expected to be 315,000 ounces this year, with a ramp-up to full capacity.
NEM recently received key regulatory approvals from the Province of British Columbia for its Red Chris Block Cave Project, marking a major milestone in the planned transformation of the Red Chris Mine from an open-pit operation to a large-scale block-cave mine. The approvals move the project closer to a final investment decision, which Newmont expects to make later this year.
Newmont has also divested non-core businesses as it shifts its strategic focus to Tier 1 assets. The company generated $3.6 billion from its portfolio optimization actions in 2025. These funds will support Newmont’s capital allocation strategy, which focuses on reinforcing its balance sheet and delivering returns to its shareholders.
NEM’s Capital Allocation Backed by Solid Financial Health
Newmont has a strong liquidity position and generates substantial cash flows, which allow it to fund its growth projects, meet short-term debt obligations and drive shareholder value. At the end of the first quarter of 2026, Newmont had robust liquidity of roughly $12.8 billion, including cash and cash equivalents of around $8.8 billion. Its free cash flow surged 161% year over year to a record $3.1 billion in the first quarter, led by an increase in net cash from operating activities. Net cash from operating activities amounted to $3.8 billion in the first quarter, up from $2 billion in the year-ago quarter.
Newmont stands to benefit from still-elevated gold prices, which should drive its profitability and cash flow generation. While gold prices have experienced a significant downward correction after reaching peak levels in January 2026, they remain at supportive levels. Heightened geopolitical tensions, a weaker U.S. dollar, tariff-related worries and concerns surrounding the Federal Reserve’s independence had driven bullion to a record high of nearly $5,600 per ounce in late January. Since then, gold has pulled back sharply due to inflation concerns triggered by a surge in crude oil prices amid Middle East tensions, with prices falling to $4,500 per ounce around the end of May.
Bullion continued to retreat in June, with prices slipping below $4,000 per ounce to a near eight-month low amid rate-hike expectations and a stronger greenback, despite reduced inflation concerns following the interim agreement between the United States and Iran. Meanwhile, the Fed held interest rates steady in the latest policy meeting, but signaled a potential rate increase before the year's end. Aggressive profit-booking also contributed to the slump in gold prices.
Gold prices recouped some losses last week to climb above $4,100 per ounce, but again eased toward $4,000 per ounce lately as an uptick in oil prices outweighed soft U.S. inflation data. Bullion is up roughly 21% year over year.
NEM has distributed $3.4 billion to its shareholders through dividends and share repurchases in 2025. It has returned $2.7 billion to its shareholders since Feb. 19, 2026. Newmont has executed buybacks of $6 billion under the earlier authorized share repurchase programs, including $2.4 billion since the fourth-quarter 2025 earnings call. Its board has approved an additional $6 billion repurchase program. NEM offers a dividend yield of 1.1% at the current stock price. Its payout ratio is 12%.
Newmont also remains committed to deleveraging, reducing debt by roughly $3.4 billion in 2025. It reduced debt by an additional $42 million in the first quarter, resulting in a strong net cash position of $3.2 billion.
Weaker Production, Higher Costs Cloud NEM’s Prospects
NEM saw lower gold production for the first quarter, partly linked to its strategic divestment of non-core assets. NEM reported a roughly 16% year-over-year and 10% sequential decline in attributable gold production to 1.3 million ounces. Newmont expects second-quarter 2026 production to be below the first-quarter level.
The company anticipates gold production at about 5.26 million ounces for 2026, indicating a year-over-year decline from 5.89 million ounces in 2025. NEM expects lower production from Penasquito and Cadia in 2026 due to the site transitions. It also sees lower-than-expected production from Nevada Gold Mines and Pueblo Viejo. These will be partly offset by contributions from the newly commissioned Ahafo North mine.
Lower production is expected to lead to higher unit costs in 2026. NEM expects all-in-sustaining costs (AISC) — a critical cost metric for miners — to be $1,680 per ounce on a by-product basis, a notable increase from $1,358 per ounce in 2025. The expected increase is due to lower sales volumes as a result of planned mine sequencing, higher royalties and production taxes, deferral of sustaining capital from 2025 into 2026 and inventory changes. Newmont also sees a significant sequential increase in unit costs in the second quarter, partly due to increased sustaining capital spending, higher costs associated with sales at Boddington, Tanami, Lihir and Penasquito and increased oil prices. The production decline and higher costs could undercut the profitability goals.
NEM’s Earnings Estimates Moving Lower
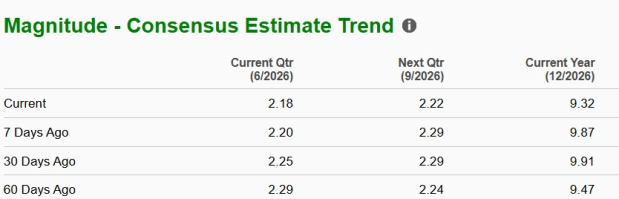
Newmont’s earnings estimates for 2026 have been going down over the past 60 days. The Zacks Consensus Estimate for second-quarter 2026 has also been revised lower over the same time frame.
The Zacks Consensus Estimate for 2026 earnings is currently pegged at $9.32, suggesting year-over-year growth of 35.3%. Earnings are expected to grow roughly 52.5% in the second quarter.
A Look at Newmont Stock’s Valuation
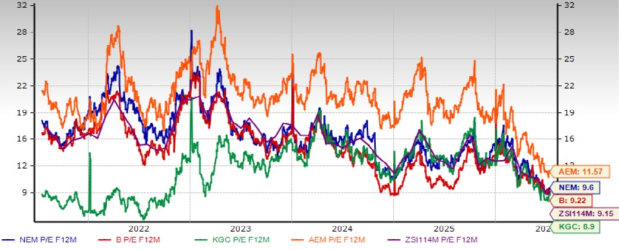
Newmont is currently trading at a forward price/earnings of 9.6X, a 4.9% premium to the industry average of 9.15X. NEM is trading at a premium to Barrick and Kinross Gold and at a discount to Agnico Eagle. Newmont and Kinross Gold currently have a Value Score of B each. Barrick and Agnico Eagle have a Value Score of A and C, respectively.
NEM’s P/E F12M Vs. Industry, B, AEM and KGC
Conclusion: Hold Onto NEM Shares
Newmont is well-positioned for growth, backed by strong operating performance and a robust project pipeline that is expected to expand production capacity, extend mine life and support revenue and earnings growth. The company’s asset optimization, which prioritizes investment in high-return, long-life assets, further enhances its long-term prospects.
Despite the significant downswing in bullion prices, higher year-over-year realized prices should continue to boost NEM’s profitability and drive cash flow generation. However, lower production stemming from divestitures and lower ore grades, along with elevated costs, could pressure overall performance. Investors who already own this Zacks Rank #3 (Hold) stock may consider continuing to hold their positions.
You can see the complete list of today’s Zacks #1 Rank (Strong Buy) stocks here.
Radical New Technology Could Hand Investors Huge Gains
Quantum Computing is the next technological revolution, and it could be even more advanced than AI.
While some believed the technology was years away, it is already present and moving fast. Large hyperscalers, such as Microsoft, Google, Amazon, Oracle, and even Meta and Tesla, are scrambling to integrate quantum computing into their infrastructure.
Senior Stock Strategist Kevin Cook reveals 7 carefully selected stocks poised to dominate the quantum computing landscape in his report, Beyond AI: The Quantum Leap in Computing Power .
Kevin was among the early experts who recognized NVIDIA's enormous potential back in 2016. Now, he has keyed in on what could be "the next big thing" in quantum computing supremacy. Today, you have a rare chance to position your portfolio at the forefront of this opportunity.
See Top Quantum Stocks Now >>Want the latest recommendations from Zacks Investment Research? Today, you can download 7 Best Stocks for the Next 30 Days. Click to get this free report
Newmont Corporation (NEM): Free Stock Analysis Report
Kinross Gold Corporation (KGC): Free Stock Analysis Report
Agnico Eagle Mines Limited (AEM): Free Stock Analysis Report
Barrick Mining Corporation (B): Free Stock Analysis Report
This article originally published on Zacks Investment Research (zacks.com).