

The Goldman Sachs Group, Inc. GS has reported third-quarter 2026 earnings per share of $17.01, which topped the Zacks Consensus Estimate by 31.9%. The metric also jumped 39% from $12.25 a year ago.
Driven by robust client activity, Goldman posted net revenues of $6.44 billion in Equities, which jumped 72% year over year, while fixed income, currencies and commodities (FICC) revenues remained essentially unchanged at $3.47 billion. Strong dealmaking activity lifted investment banking (IB) fees 21% to $3.22 billion, supported by higher advisory, equity underwriting and debt underwriting revenues. Driven by these positives, shares of Goldman rose nearly 3% in the early trading session. A full day’s trading session will depict a clearer picture.
Goldman’s overall results benefited from strong revenue growth in the Global Banking & Markets and Asset & Wealth Management businesses, while profitability was highlighted by an annualized return on equity of 18.7%. However, higher operating expenses and increased provisions for credit losses created headwinds.
Net earnings attributable to common shareholders were $5.12 billion, up 33% year over year.
GS’s Revenues & Expenses Increase
Net revenues were $18.68 billion, rising 23% year over year and comfortably surpassing the Zacks Consensus Estimate of $16.87 billion by 10.75%.
Total non-interest revenues were $14.91 billion, up 32% year over year. The increase reflected higher investment banking revenues, investment management revenues, commissions and fees, and market-making revenues, partially offset by lower other principal transactions revenues. Net interest income was $3.77 billion, down 2% from the prior-year quarter.
On the cost side, operating expenses were $11.31 billion, up 20% from the prior-year quarter. Management attributed the increase primarily to significantly higher transaction-based expenses and higher compensation and benefits expenses, reflecting improved operating performance.
Even with higher costs, Goldman’s efficiency ratio declined 180 basis points to 60.5% for the quarter.
Provision for credit losses was $368 million, up from $339 million in the year-ago quarter, primarily reflecting impairments related to wholesale loans.
Goldman’s Quarterly Segmental Performance
The Asset & Wealth Management business generated net revenues of $5.05 billion, up 14% year over year. The increase primarily reflected significantly higher management and other fees, driven by higher average assets under supervision, and higher incentive fees from fund distributions. These positives were partially offset by lower investments and private banking, and lending revenues. Total assets under supervision increased to a record $4.10 trillion, reflecting $83 billion in total net inflows and $97 billion in long-term net inflows during the quarter.
The Global Banking & Markets business generated net revenues of $13.46 billion, up 32% year over year. Growth was driven by significantly higher Equities revenues and increased investment banking fees, while FICC revenues remained essentially unchanged. Equities benefited from significantly higher financing and intermediation revenues, while investment banking fees were supported by higher advisory, equity underwriting and debt underwriting revenues.
The Platform Solutions business reported net revenues of $170 million, down 72% from the year-ago quarter. The decline primarily reflected net markdowns related to the Apple Card loan portfolio, which had previously been transferred to held for sale.
GS’ Balance Sheet & Capital Position
Goldman ended the third quarter with total assets of $2.18 trillion, up from $2.13 trillion at the end of the second quarter, while deposits were $568 billion compared with $558 billion in the previous quarter. Total loans increased sequentially to $276 billion from $261 billion.
Capital ratios showed mixed trends sequentially. The standardized CET1 capital ratio declined to 12.4% from 12.9%, while the advanced CET1 ratio remained unchanged at 13.6%. The supplementary leverage ratio was stable at 4.3%.
During the quarter, Goldman returned $4.49 billion to shareholders, including $3 billion in common share repurchases and $1.49 billion in common stock dividends. Moreover, the company declared a quarterly dividend of $5 per share, payable Dec. 30, 2026.
Our View on GS
Goldman delivered strong third-quarter results, fueled by robust Equities performance and higher IB revenues. Solid client activity, strong capital markets execution and continued momentum in Asset & Wealth Management drove the results. The IG Wealth Management collaboration, and planned LCN and NEOS acquisitions are likely to strengthen Asset & Wealth Management. While higher operating expenses and increased credit costs remain worth monitoring, record assets under supervision, growth in loans and deposits and continued capital distributions highlight the company’s operating performance.
The Goldman Sachs Group, Inc. Price, Consensus and EPS Surprise
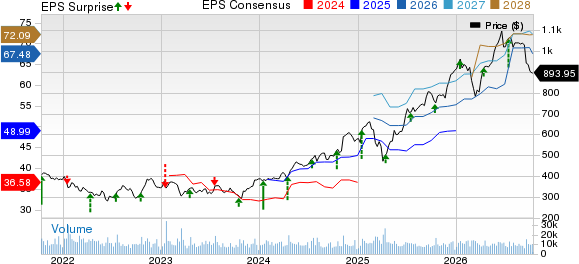
The Goldman Sachs Group, Inc. price-consensus-eps-surprise-chart | The Goldman Sachs Group, Inc. Quote
Currently, Goldman carries a Zacks Rank #3 (Hold). You can see the complete list of today’s Zacks #1 Rank (Strong Buy) stocks here.
Earnings Dates & Expectations of Other Banks
U.S. Bancorp USB is scheduled to report third-quarter 2026 results on Oct. 15.
The Zacks Consensus Estimate for U.S. Bancorp’s quarterly earnings has been unchanged at $1.32 per share over the past seven days. This indicates an 8.2% increase from the prior-year quarter’s reported figure.
M&T Bank MTB is slated to report third-quarter 2026 numbers on Oct. 16.
Over the past week, the Zacks Consensus Estimate for M&T Bank’s quarterly earnings has been revised downward to $4.98 per share, indicating a 2.3% increase from the prior-year quarter’s reported figure.
7 Best Stocks for the Next 30 Days
Just released: Experts distill 7 elite stocks from the current list of 220 Zacks Rank #1 Strong Buys. They deem these tickers "Most Likely for Early Price Pops."
Since 1988, the full list has beaten the market more than 2X over with an average gain of +23.9% per year. So be sure to give these hand picked 7 your immediate attention.
See them now >>Want the latest recommendations from Zacks Investment Research? Today, you can download 7 Best Stocks for the Next 30 Days. Click to get this free report
The Goldman Sachs Group, Inc. (GS): Free Stock Analysis Report
U.S. Bancorp (USB): Free Stock Analysis Report
M&T Bank Corporation (MTB): Free Stock Analysis Report
This article originally published on Zacks Investment Research (zacks.com).