
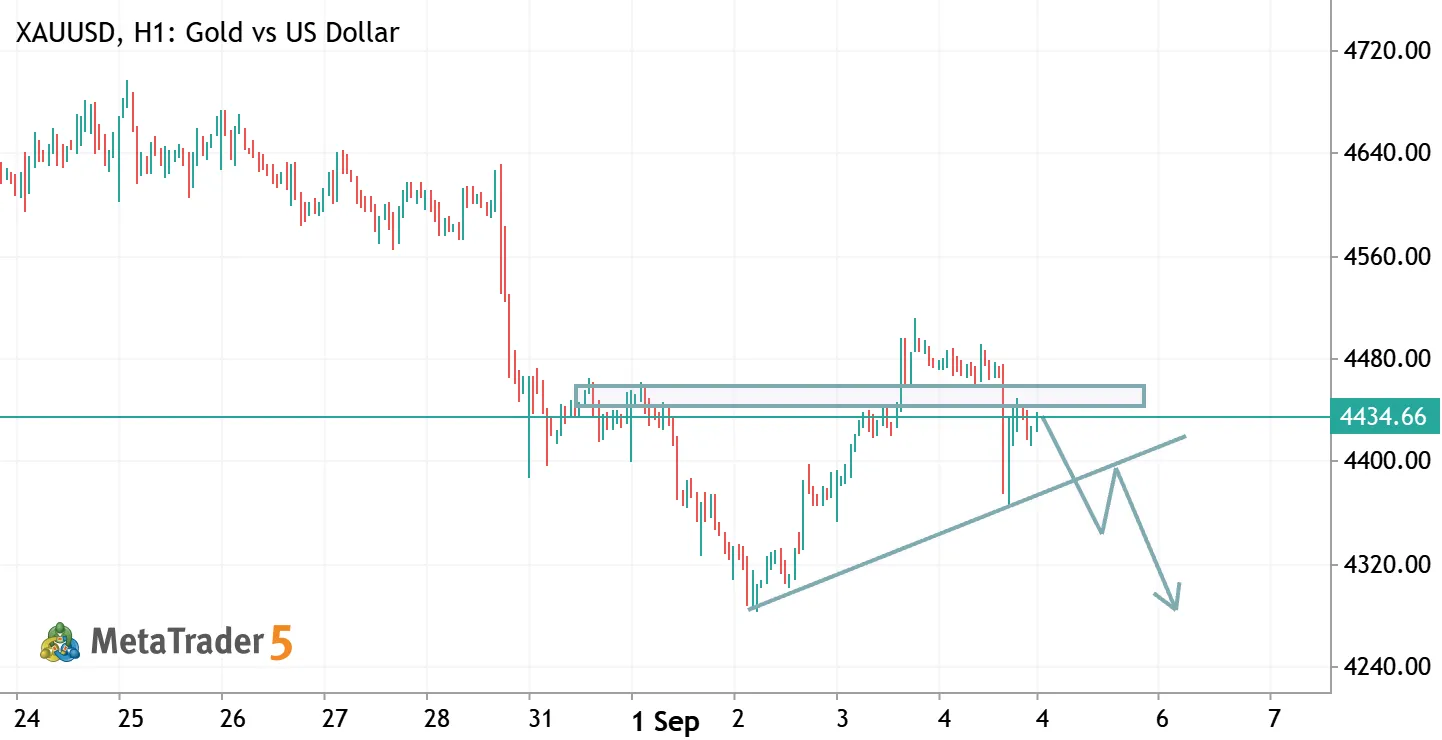
XAUUSD (Gold) H1 Technical Analysis
The H1 chart of Gold against the US Dollar shows a bearish structural breakdown following a rejection from the key resistance zone. After a sharp sell-off from the 4600.00–4700.00 region, price consolidated before breaking above the horizontal supply zone near 4450.00–4460.00 to sweep liquidity.
However, price failed to sustain higher levels and aggressively dropped back below the 4450.00 resistance level (currently trading around 4434.66). The visual forecast illustrates a potential retest of the ascending trendline/support zone, followed by a pullback retest of the broken trendline, before continuing the downward movement toward the major demand level near 4300.00.
Hypothetical Signal Idea (Educational Setup)
- Direction: Sell / Short
- Entry Zone: 4430.00 – 4445.00 (on retest of resistance or trendline breakdown)
- Stop Loss (SL): 4475.00 (above the recent swing high and horizontal zone)
- Take Profit 1 (TP1): 4370.00 (near the trendline support region)
- Take Profit 2 (TP2): 4300.00 (major structural target at lower support)
Disclaimer: This analysis and hypothetical trade signal are for educational purposes only and do not constitute financial or investment advice. Always manage your risk according to your personal trading strategy.

 Profilo MQL5
Nuovo commento