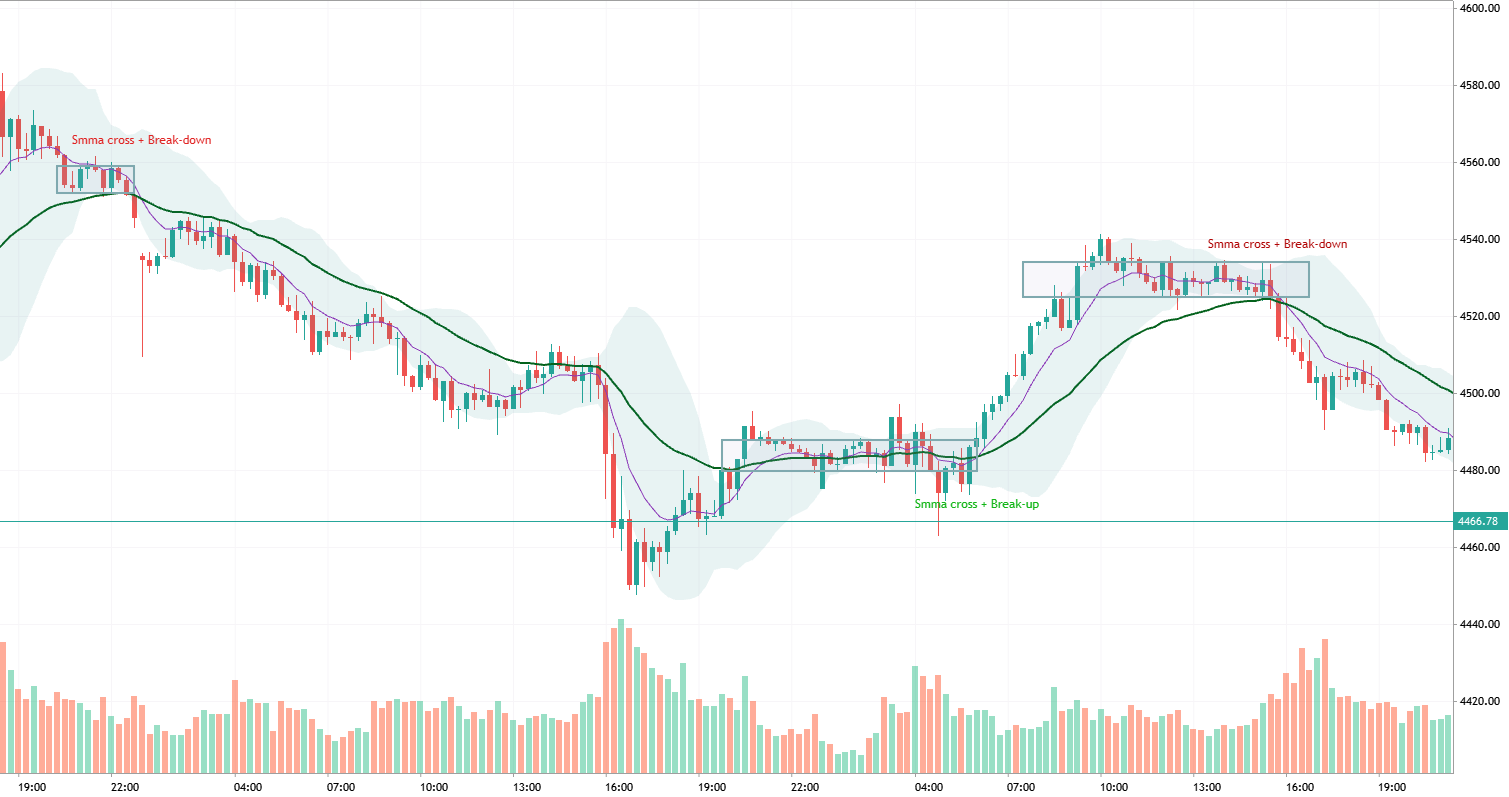
Smma cross + Breakout
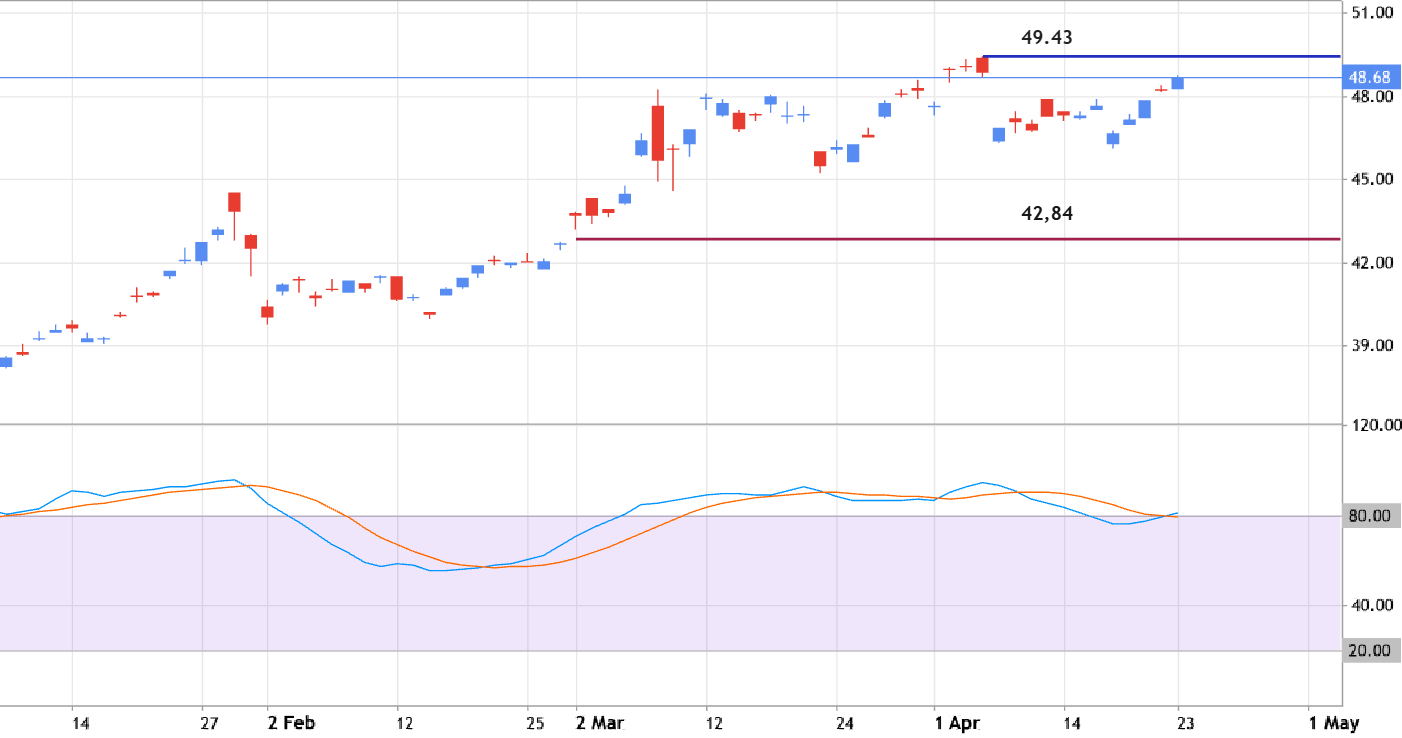
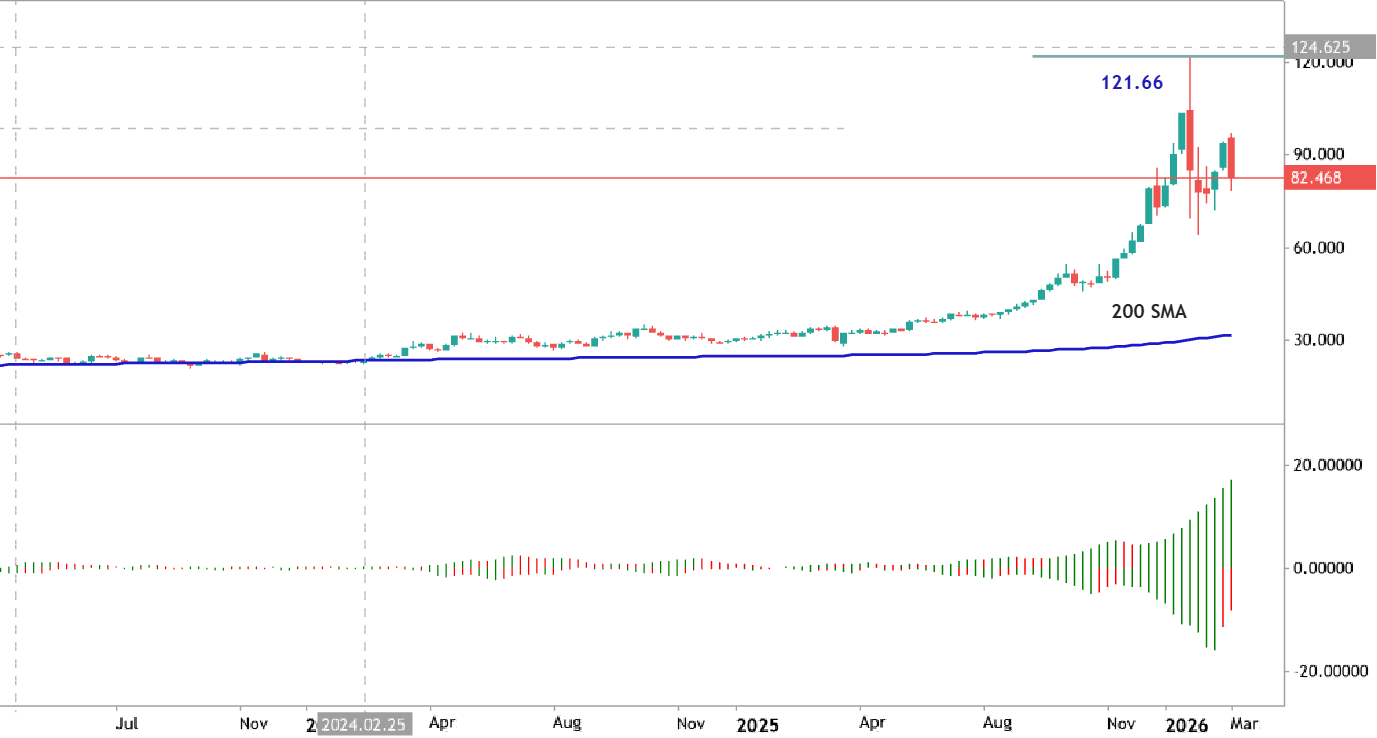
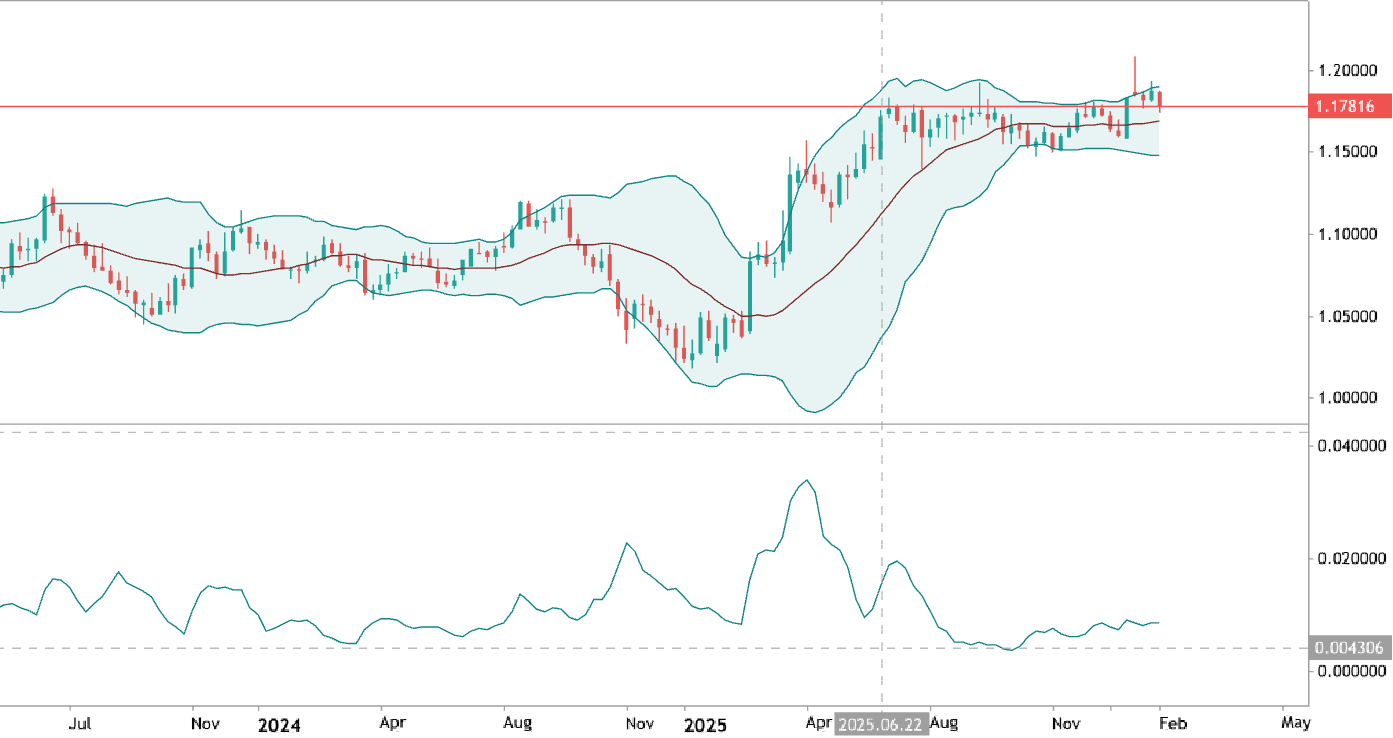
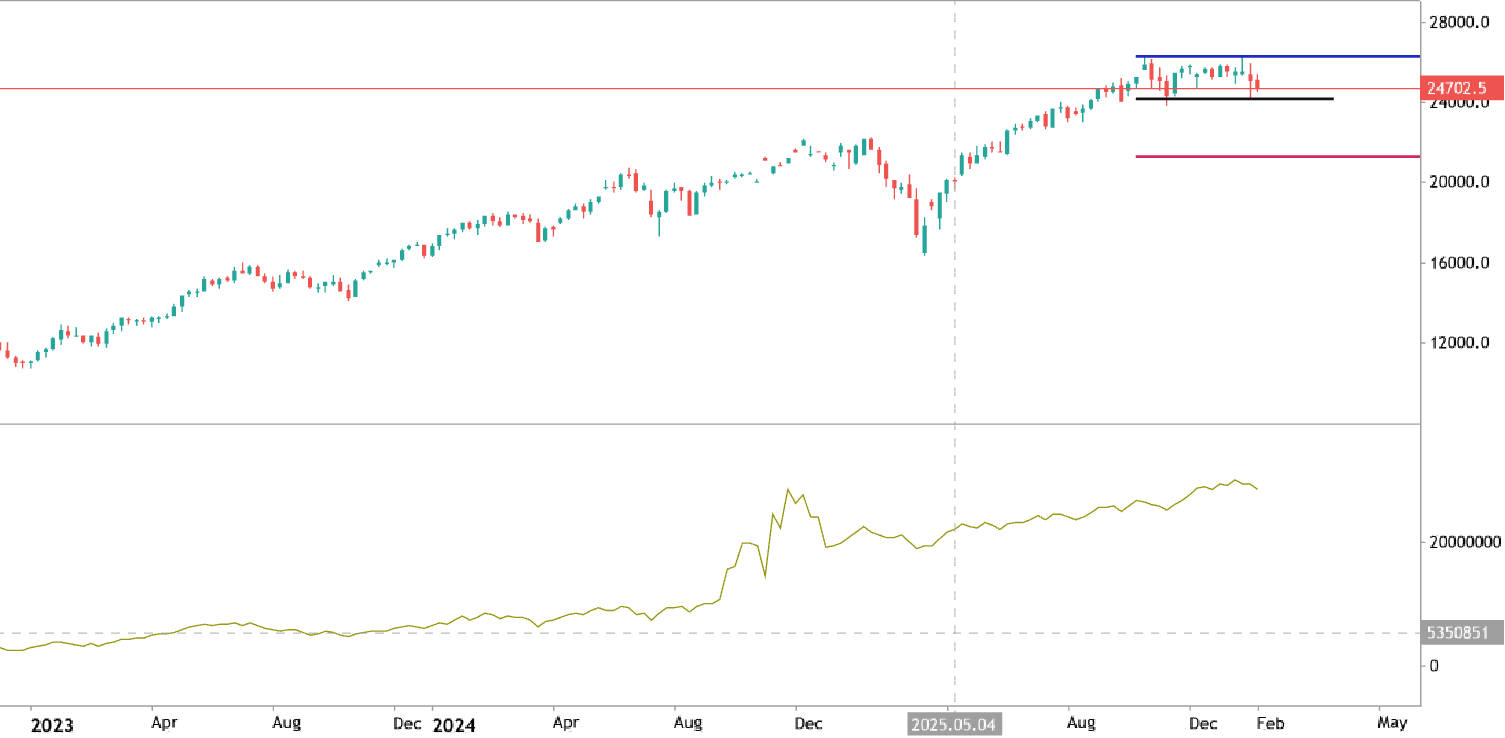
SMMA Cross + Breakout Confirmation Strategy Trading Idea Market Analysis The market is currently transitioning from consolidation into a potential trend phase. This setup combines SMMA crossover signals with range breakout confirmation to identify higher-probability trading opportunities. Bullish Scenario Fast SMMA crosses above Slow SMMA. Price consolidates within a defined range. A candle closes above resistance. Volume and momentum support the breakout. Key Levels Range Resistance: Breakout Trigger Range Support: Invalidation Level Previous Swing High: Target Area Invalidation Price closes back inside the range. Fast SMMA crosses below Slow SMMA. Bearish Scenario Fast SMMA crosses below Slow SMMA. Price consolidates before breaking support. Downside breakout confirms bearish momentum
1