JPMorgan JPM posted first-quarter 2026 earnings of $5.94 per share, up 17.2% from $5.07 in the year-ago quarter. The bottom line beat the Zacks Consensus Estimate of $5.49 by 8.2%.
Reported net revenues of $49.8 billion increased 10.0% year over year. The metric also topped the consensus mark of $48.6 billion.
Quarterly results were powered by a record Markets performance, robust investment banking (IB) business and higher net interest income (NII).
Net income climbed 13% year over year to $16.5 billion.
JPM’s Markets Strength and Fee Growth Set the Tone
The quarter’s tone was defined by robust client activity in trading and better fee momentum. In the Commercial & Investment Bank (CIB) segment, Markets revenues rose 20% year over year to $11.6 billion, supported by gains in both Fixed Income Markets and Equity Markets. Fixed Income Markets revenues increased 21% to $7.1 billion, reflecting strength in Commodities, Credit and Currencies & Emerging Markets, alongside continued momentum in Securitized Products. Equity Markets revenues grew 17% to $4.5 billion on increased client activity.
Investment banking improved meaningfully from the prior year, with IB fees up 28% to $2.88 billion. Within the CIB, IB revenue rose 38% to $3.14 billion, driven by higher advisory and equity underwriting fees, partly offset by lower debt underwriting fees. Payments also stayed constructive, with revenue up 12% to $5.12 billion, benefiting from higher deposit balances and fee growth.
JPMorgan’s NII Lifted by Balance Sheet Growth
NII remained an important earnings contributor. Firmwide NII increased 9% year over year to $25.37 billion on a reported basis, while managed NII was $25.48 billion.
JPMorgan also reported that NII excluding Markets was $23.3 billion, up 3% year over year. This was driven by higher deposit balances and higher revolving balances in Card Services, partly offset by the impact of lower rates.
Balance sheet expansion supported the revenue backdrop. Average loans rose 11% year over year to $1.5 trillion, and average deposits increased 7% to $2.6 trillion. The combination of loan growth and deposit balances helped sustain interest income even as rate dynamics weighed on certain areas.
Expense Build and Credit Costs Remained Key Offsets for JPM
Total non-interest expense increased 14% year over year to $26.85 billion. Compensation expense rose to $15.34 billion, and marketing climbed to $1.6 billion, reflecting ongoing investment and business activity levels. Higher brokerage expenses and distribution fees, as well as higher auto lease depreciation, were other reasons for the rise in non-interest income.
Credit metrics were mixed but manageable on an aggregate basis. Provision for credit losses was $2.51 billion, with credit costs of $2.5 billion that included $2.3 billion of net charge-offs (NCOs) and a $191 million net reserve build.
The reserve build reflected a $327 million net build in Wholesale and a $139 million net release in Consumer.
NCOs were essentially stable year over year, down by $16 million to $2.3 billion.
JPM’s Segment Results Highlighted CIB Outperformance
Performance across segments remained solid, with the CIB standing out on revenues and earnings leverage.
CIB net income increased 30% year over year to $9.04 billion as revenue rose 19% to $23.38 billion. The mix was balanced across Banking & Payments and Markets & Securities Services, with Markets again providing the largest incremental boost.
Consumer & Community Banking (CCB) delivered steady growth. Segment net income rose 12% to $5 billion and revenues increased 7% to $19.57 billion, with strength in Card Services & Auto helping offset more modest trends elsewhere. In CCB, debit and credit card sales volume increased 9% year over year to $487.6 billion, and active mobile customers grew 7% to 63 million, pointing to continued customer engagement and franchise momentum.
Asset & Wealth Management also posted healthy results, with net income up 12% to $1.78 billion on 11% revenue growth to $6.37 billion. Assets under management were $4.79 trillion, up 16% year over year, and client assets rose 18% to $7.1 trillion, reflecting higher market levels and net inflows.
Corporate net income was $699 million compared with $1.7 billion a year ago, influenced by a year-ago benefit tied to a First Republic-related gain.
JPMorgan’s Capital Returns & Management Outlook for 2026
JPMorgan’s capital position remained strong, even as ratios eased versus year-ago levels. The standardized CET1 capital ratio was 14.3% at March 31, 2026, with CET1 capital of $291.1 billion.
Book value per share rose 8% year over year to $128.38, and tangible book value per share increased 8% to $108.87.
Shareholder returns stayed elevated. The bank paid a common dividend of $4.1 billion, or $1.50 per share, and reported $8.1 billion of common stock net repurchases during the quarter.
Management now expects 2026 NII of approximately $103 billion, down from the previous target of $104.5 billion. NII excluding Markets is expected to be almost $95 billion. The company also projected nearly $105 billion of adjusted expenses for 2026 and expects a Card Services NCO rate of about 3.4%.
Our View on JPMorgan
New branch openings, strategic acquisitions, global expansion efforts and decent loan demand are likely to keep aiding JPMorgan’s revenues. Yet, as the rates decline, the company’s NII expansion pace is expected to slow down, while an improving lending scenario will offer some support. Weak asset quality and mounting expenses are concerns.
JPMorgan Chase & Co. Price, Consensus and EPS Surprise
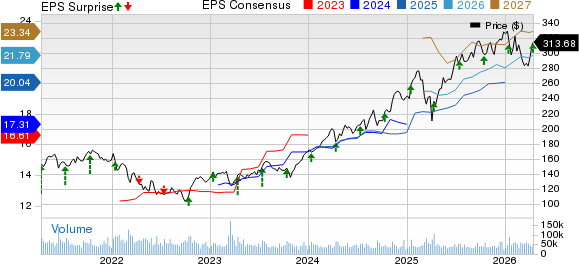
JPMorgan Chase & Co. price-consensus-eps-surprise-chart | JPMorgan Chase & Co. Quote
JPMorgan currently carries a Zacks Rank #3 (Hold). You can see the complete list of today’s Zacks #1 Rank (Strong Buy) stocks here.
Performance & Earnings Dates of JPM’s Peers
The Goldman Sachs Group, Inc.’s GS first-quarter 2026 earnings per share of $17.55 topped the Zacks Consensus Estimate by 7.4%. The metric also rose 24.3% from $14.12 a year ago.
Driven by the volatile market, Goldman posted record net revenues in Equities, while its fixed income, currencies, and commodities intermediation business revenue fell. A solid dealmaking activity led to a robust growth in IB fees. Further, the company’s Asset & Wealth Management division posted solid revenue growth. However, a rise in expenses and provision for credit losses were headwinds.
Bank of America BAC is slated to report first-quarter 2026 numbers on April 15
Over the past week, the Zacks Consensus Estimate for Bank of America’s quarterly earnings has been revised north to $1.00. This indicates a 11.1% rise from the prior-year quarter.
Beyond Nvidia: AI's Second Wave Is Here
The AI revolution has already minted millionaires. But the stocks everyone knows about aren't likely to keep delivering the biggest profits. Little-known AI firms tackling the world's biggest problems may be more lucrative in the coming months and years.
SeeWant the latest recommendations from Zacks Investment Research? Today, you can download 7 Best Stocks for the Next 30 Days. Click to get this free report
The Goldman Sachs Group, Inc. (GS): Free Stock Analysis Report
Bank of America Corporation (BAC): Free Stock Analysis Report
JPMorgan Chase & Co. (JPM): Free Stock Analysis Report
This article originally published on Zacks Investment Research (zacks.com).