


The Procter & Gamble Company PG has delivered third-quarter fiscal 2026 results that topped the Zacks Consensus Estimate for both earnings and revenues and improved year over year. Results benefited from organic sales growth, driven by higher volume and pricing.
From an earnings quality standpoint, the quarter reflected continued productivity savings across the P&L. Core operating income increased from the prior year after adjusting for incremental restructuring, even as the company absorbed mix pressure and incremental spending designed to support innovation and demand creation.
Management maintained its fiscal 2026 outlook, but earnings are expected to trend toward the lower end of the range as cost headwinds persist and investments step up.
Procter & Gamble’s core EPS of $1.59 per share rose 3% from the year-ago quarter and beat the Zacks Consensus Estimate of $1.56 by 1.9%. Currency-neutral core EPS of $1.54 was unchanged from last year, indicating that foreign exchange provided a meaningful tailwind to reported core per-share earnings growth in the period.
Net sales increased 7% from the year-ago period to $21.24 billion, beating the consensus mark of $20.58 billion by 3.2%. PG’s reported net sales growth was supported by a favorable foreign exchange backdrop and steady underlying demand.
Procter & Gamble Company (The) Price, Consensus and EPS Surprise
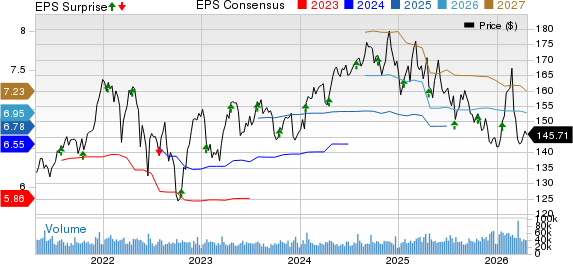
Procter & Gamble Company (The) price-consensus-eps-surprise-chart | Procter & Gamble Company (The) Quote
For the fiscal third quarter, total company net sales benefited from a 2% increase in volume, a 4% benefit from foreign exchange and a 1% gain from pricing, while mix was neutral. Organic sales advanced 3% from the prior year, reflecting the combination of higher unit volumes and pricing.
Our model predicted year-over-year organic revenue growth of 2.4% for the third quarter of fiscal 2026, with 1.4% growth from pricing, a 0.7% rise in the product mix and a 0.4% gain in the organic volume.
Category performance was broadly constructive. In the fiscal third quarter, Beauty posted net sales of $3.87 billion, up 11% year over year, with organic sales growth of 7%. Fabric & Home Care remained the largest contributor at $7.4 billion, up 7%, and delivered 3% organic sales growth. Baby, Feminine & Family Care generated $5.06 billion in sales, up 6%, with organic sales also up 3%. Health Care increased 7% to $3.07 billion, with organic sales growth of 2%. Grooming rose 7% to $1.61 billion, though its organic sales growth was more modest at 1%.
The organic mix of growth also varied by segment. Beauty’s organic sales increase reflected a combination of volume, pricing and favorable mix, while Fabric & Home Care’s organic sales gain was tied to volume and pricing improvements. Grooming and Health Care each faced modest organic volume declines, which tempered organic sales growth despite pricing benefits.
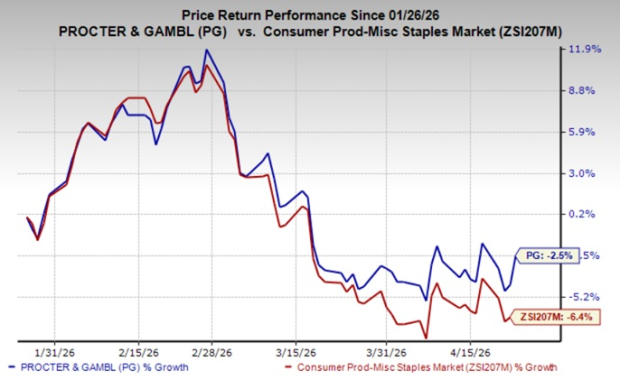
PG shares rose 2.8% in the pre-market session following the third-quarter fiscal 2026 results. This Zacks Rank #4 (Sell) company’s stock has lost 2.5% in the past three months compared with the industry’s 6.4% decline.
Image Source: Zacks Investment Research
Procter & Gamble Margins Pressured by Mix & Reinvestment
PG’s profitability profile softened year over year as the company stepped up reinvestment and worked through mix and tariff headwinds. The reported gross margin declined 150 basis points (bps) to 49.5% in the fiscal third quarter. The core gross margin fell 100 bps to 50%, excluding the impacts of incremental restructuring charges.
Management attributed the core gross margin decline primarily to an unfavorable mix impact of 180 bps, reinvestments of 100 bps and higher tariff-related costs of 50 bps. These pressures were partly offset by 210 bps of gross productivity savings and 50 bps of benefit from increased pricing. Commodity costs were a smaller drag in the period, while rounding and other items added modest friction.
On the operating expense side, reported selling, general and administrative expenses (SG&A), as a percentage of sales, were 28%, up 10 bps year over year. Core SG&A improved slightly, decreasing 10 bps to 27.8%, helped by productivity savings and scale benefits from higher net sales.
The core operating margin declined 80 bps to 22.2%, reflecting the combined impacts of a lower gross margin and elevated reinvestment. The operating margin included gross productivity savings of 330 bps.
We expected the core gross profit margin to decline 10 bps year over year in the fiscal third quarter to 50.9%. The core SG&A expense rate was anticipated to increase 10 bps, whereas the core operating margin was expected to be flat year over year at 23%.
Peek Into PG's Financials
PG’s balance sheet liquidity has strengthened in the year-to-date period. As of March 31, 2026, cash and cash equivalents were $12.3 billion, up from $9.6 billion at June 30, 2025. Total assets were $128.38 billion, while total shareholders’ equity stood at $54.7 billion. Debt due within a year increased to $13.2 billion and long-term debt was $23.9 billion.
Procter & Gamble continued to emphasize shareholder returns alongside investment in the business. In third-quarter fiscal 2026, the company generated an operating cash flow of $4 billion. The adjusted free cash flow was $3.03 billion for the three months ended March 31, 2026, with an adjusted free cash flow productivity of 82% based on the adjusted free cash flow as a percentage of net earnings, excluding the Glad joint venture gain.
PG returned $3.2 billion in cash to shareholders in the fiscal third quarter, including $2.5 billion in dividend payments and more than $600 million in share repurchases. The dividend increase announced earlier in April also marked the 70th consecutive year of dividend increases and the 136th consecutive year of dividends paid out since incorporation.
PG Maintains FY26 Outlook, Flags Headwinds
Procter & Gamble has maintained its fiscal 2026 guidance while signaling that EPS is expected to land toward the lower end of the outlook as the company increases investment levels. PG projects all-in sales growth of 1-5% for fiscal 2026, including an estimated one-percentage-point tailwind from foreign exchange and acquisitions and divestitures. Organic sales growth is expected to be in the range of in-line to up 4%.
Management has reiterated its outlook for EPS growth of 1-6%, whereas it reported EPS of $6.51 in fiscal 2025. Core EPS growth is expected to be in the range of in-line to up 4%, implying a core EPS of $6.83-$7.09 for fiscal 2026. Meanwhile, the company registered a fiscal 2025 core EPS of $6.83
The updated cost framework includes commodity cost expectation of $150 million after-tax headwind and tariff-related costs estimated at $400 million after tax. Foreign exchange is forecast to be a $200-million after-tax tailwind, while net interest expenses and a higher core effective tax rate are expected to be a $250 million after-tax headwind. Collectively, these factors equate to a headwind of 25 cents per share for fiscal 2026. PG expects the core effective tax rate to be 20-21% in fiscal 2026.
Procter & Gamble expects capital expenditure to be 4-5% of net sales for fiscal 2026. The adjusted free cash flow productivity is estimated to be 85-90%. The company intends to pay out dividends worth $10 billion and repurchase shares worth $5 billion in fiscal 2026.
Here’s How Better-Ranked Stocks Fared
Krispy Kreme DNUT operates as a branded retailer and wholesaler of doughnuts, coffee and other complementary beverages, and treats and packaged sweets. It currently sports a Zacks Rank #1 (Strong Buy). You can see the complete list of today’s Zacks #1 Rank stocks here.
The Zacks Consensus Estimate for Krispy Kreme’s 2026 earnings indicates growth of 60% from the prior-year reported level. DNUT delivered a trailing four-quarter earnings surprise of 14.6%, on average.
Darling Ingredients DAR is a provider of rendering, cooking oil and bakery waste recycling and recovery solutions. It currently flaunts a Zacks Rank of 1.
The Zacks Consensus Estimate for Darling Ingredients’ 2026 sales and earnings indicates growth of 6% and 433%, respectively, from the year-ago reported numbers. DAR delivered a trailing four-quarter negative earnings surprise of 41%, on average.
Purple Innovation PRPL designs and manufactures products that include mattresses, pillows and cushions, using its patented Hyper-Elastic Polymer. It currently carries a Zacks Rank #2 (Buy).
The Zacks Consensus Estimate for Purple Innovation’s 2026 sales and earnings is expected to rise 6.6% and 25%, respectively, from the year-ago reported figures. PRPL delivered a trailing four-quarter earnings surprise of 22.7%, on average
7 Best Stocks for the Next 30 Days
Just released: Experts distill 7 elite stocks from the current list of 220 Zacks Rank #1 Strong Buys. They deem these tickers "Most Likely for Early Price Pops."
Since 1988, the full list has beaten the market more than 2X over with an average gain of +23.9% per year. So be sure to give these hand picked 7 your immediate attention.
See them now >>Want the latest recommendations from Zacks Investment Research? Today, you can download 7 Best Stocks for the Next 30 Days. Click to get this free report
Procter & Gamble Company (The) (PG): Free Stock Analysis Report
Darling Ingredients Inc. (DAR): Free Stock Analysis Report
PURPLE INNOVATION, INC. (PRPL): Free Stock Analysis Report
Krispy Kreme, Inc. (DNUT): Free Stock Analysis Report
This article originally published on Zacks Investment Research (zacks.com).