While many people started to learn about the stock market and investing for the first time during the pandemic, as a semi-retired investor, I did things a little differently. With the stock market already under my belt, so to speak, the pandemic is when my interest in horse racing first started to expand beyond the casual.
Why? Because for a while, it was about the only sport that didn’t miss a beat. Races from around the US continued on, while the major sports leagues tried to figure out their plan.
Don’t Miss a Day: From crude oil to coffee, sign up free for Barchart’s best-in-class commodity analysis.
I even went to my local track, Gulfstream Park, and sat in a portable chair trackside, writing articles and being outdoors, getting as close to the action as possible (you can catch reasonably good views and weather from the parking lot during a pandemic, especially when you live in South Florida).
Based on that combined experience, I’ve come to the conclusion that stock market investing and horse race handicapping are really not that different.
And with the first Saturday in May upon us, the air at Churchill Downs is thick with more than just the smell of mint juleps and bluegrass. It is filled with the same kind of speculative electricity that currently charges the SPDR S&P 500 ETF (SPY), the Invesco QQQ Trust (QQQ), and the rest of the stock market.
Here’s how to lean into the excitement of whichever pastime happens to be your favorite.
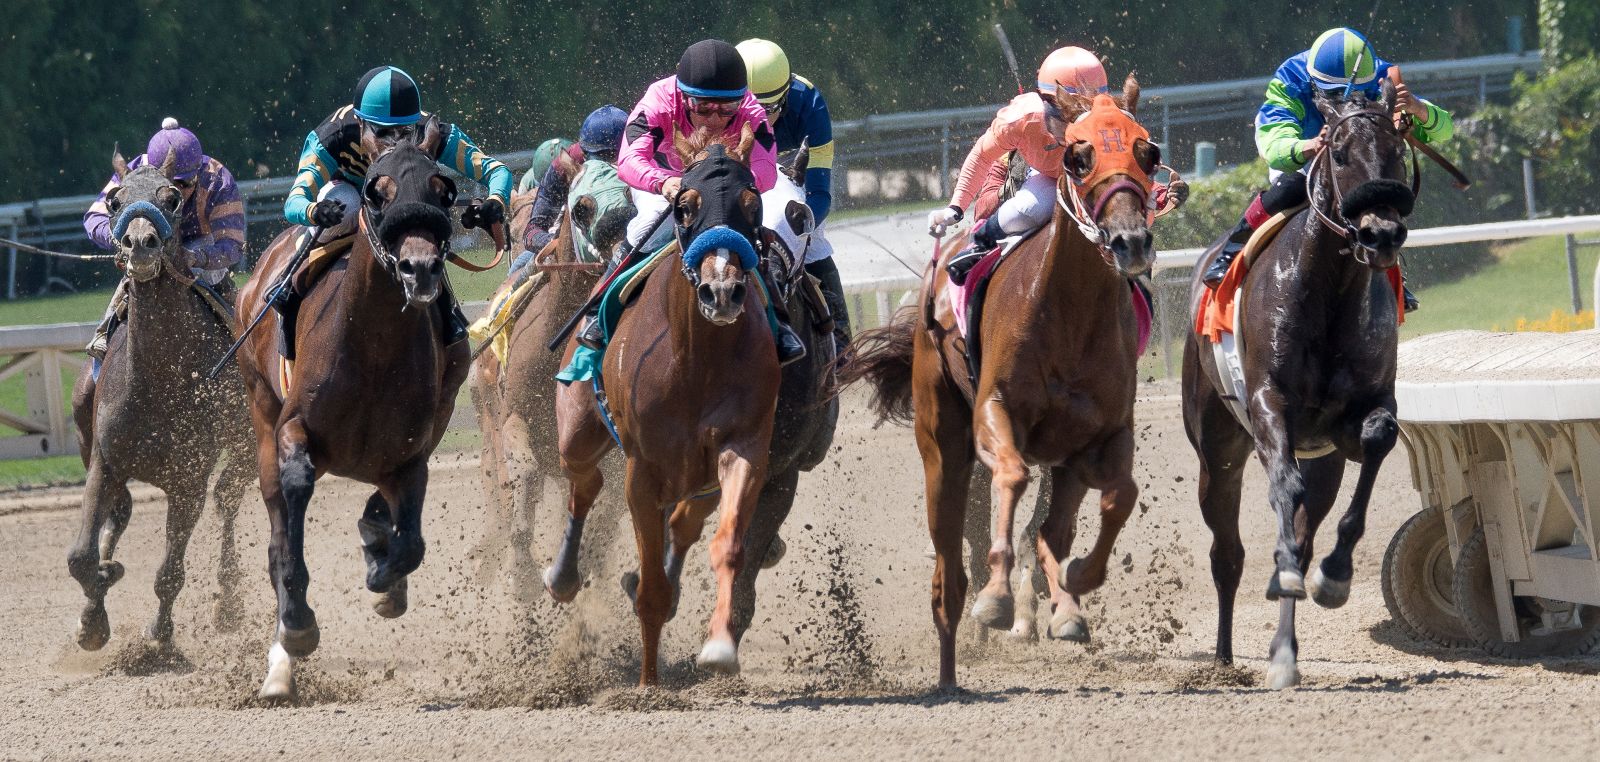
The ‘Saturday Super Bowl’ of Horse Racing
This Saturday’s Kentucky Derby, the 152nd edition, offers a lot of useful comparisons to what successful investors do all the time. For example:
We work hard to learn the “game” We develop our own style, including deciding which variables matter We keep current on what’s working and how the industry evolves We look for any angle or new information that might give us an edge We understand that the “odds” are simply probabilities, not prologues We appreciate that there are many different ways to scout and value the assets we are analyzing, and that different times favor different factors. Longshots may win, and favorites may lose, but there’s always another race. There’s a blurred line between the business and entertainment aspects of it all. The winners tend to be the ones who enjoy both.But I can get a lot more specific than that.
There are 20 horses running in the Derby, whereas I regularly report for Barchart on the top 20 S&P 500 stocks by size. Here they are as of Wednesday:
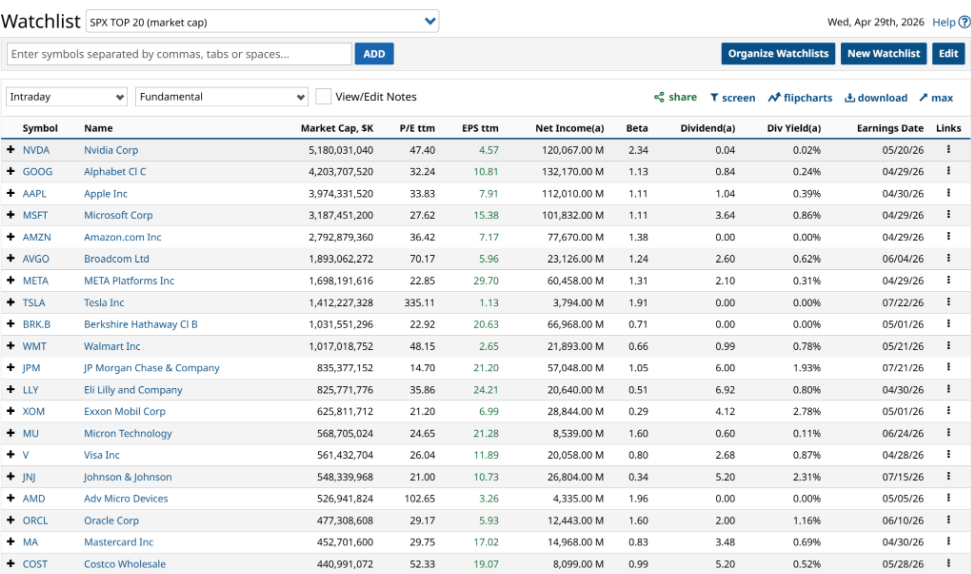 Top 20 S&P 500 members by market cap.
 Whether you’re staring at a racing form or a candlestick chart, the challenge remains the same: separating the true thoroughbreds from the contenders that are “good on paper.”
There’s certainly enough attention heaped on both categories these days, and no shortage of opinions.
Here, backed by a healthy dose of research and experience, are mine.
When Big Stocks Meet Big Animals
I have my own approach to charting the races as I do charting stocks and ETFs. But to handicap this “fastest two minutes in sports” event, I decided to enlist a unique ally.
Victor Collazo is a CPA and an ex-Grant Thornton veteran who now runs his own practice near Philadelphia. But more importantly for our purposes, Victor is a lifelong horseman and a veteran handicapper who has spent as much time at the rail as he has at the ledger.
Victor and I recently partnered with trainer Sam Wilensky to form Claim to Fame Stables, a claiming partnership where I’m joined by two next-generation business partners who are second-generation horsemen themselves. While the Triple Crown races get the glory, we are focused on the “claiming” segment of the industry, horse racing’s “middle class.”
Together, we created this Derby Weekend guide that translates top stocks into Saturday’s top contenders, and vice versa.
If you look across each row, you’ll see those 20 biggest S&P 500 stocks by market capitalization, along with my quick take on each stock. Then, we’ve listed a “counterpart” for each of those 20 megacap stocks, in the form of a horse expected to race in this year’s Derby on Saturday at the iconic Churchill Downs racetrack in Louisville, Kentucky.
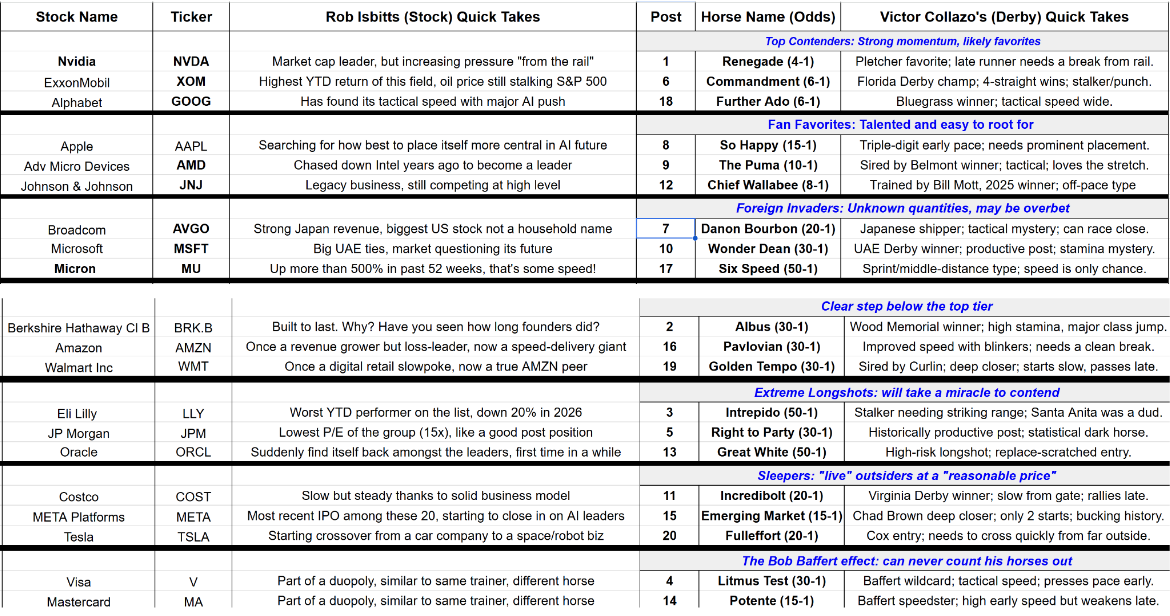
20 horses (barring any late scratches), 20 stocks, one table.
Use it as you wish – to try to see what I see every day, participating actively in both businesses; to get a snapshot view of the stocks that make up more than 45% of the current S&P 500; or to help you pick a horse to root for in the biggest race of the year if you don’t know anything about horse racing.
Or, if you happen to be more of a horse player and you run into this article, maybe this will help you translate that pursuit into understanding why the stock market has become so darn popular in recent years.
Understanding Victor’s Notes
No, those are not signals from a quarterback about to start a football play, and they’re not the start of a social security number. They are the numbered post positions of Victor’s selections for the Derby.
He likes Chief Wallabee (12) to win the 152nd Kentucky Derby. I know not only because of this, but because he’s texted me a few times on it! A bit of a longshot, well played.
He has Renegade (1) “underneath” who is one of the “top contenders” for sure. His issue is that with 19 other horses starting simultaneously, being squeezed in close to the rail can be a tough thing to overcome.
Victor rounds out his top four with Emerging Market, which is the name in this race most similar to an ETF I’ve written about here in the past, such as ticker EEM. And FullEffort (20) has an outside post position that ironically matches his early “morning line” odds (20-1). For those new to racing, that’s just a coincidence.
My Odds-On Favorite Stocks
I’ll close with a few stocks from that set of 20 whose charts make me think they could win the sprint to early June, when the Belmont Stakes at historic Saratoga rounds out horse racing’s Triple Crown. I’ll include a potential “clunker” too.
With that 5-week time frame in mind, I’ll use daily charts. In horse racing terms, that means this is not a “two-turn race” (longer distance, like the Triple Crown races), but more of a sprint to the brink of summer.
First, let’s take the aforementioned worst-looking chart of these 20. Since horses’ heights are measured in “hands” (four inches = one hand), I’ll say this about Eli Lilly (LLY): to me, it is “hands down” the ugliest chart I see from this group.
A budding late March rally took a hard turn down in April. Like a horse that’s making the final turn, but then goes too wide to get back in contention.
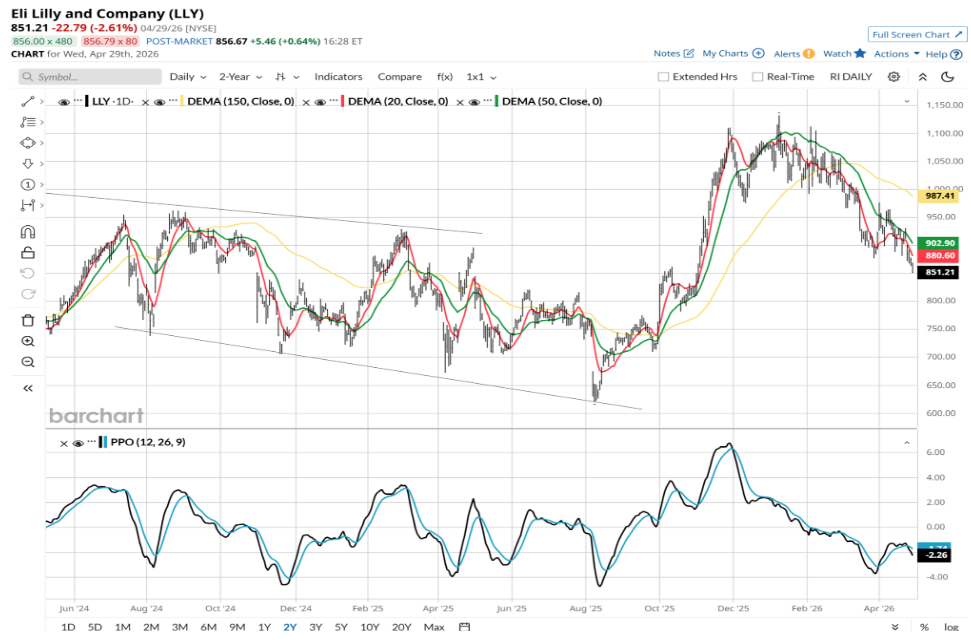 LLY looks ugly here.
 As for the three that look most intriguing to me right now, I’ll start with Berkshire Hathaway (BRK.B), which is due to report earnings this Saturday. Note that since I view the broad stock market as hanging on the edge of an AI-spending/ROI cliff, a chart like this is more about identifying a potential “mudder” in a rough market.
BRK.B is under new management for the first time since before most of us were born, and they have a lot of cash on that giant balance sheet. In a market decline, that will count for something.
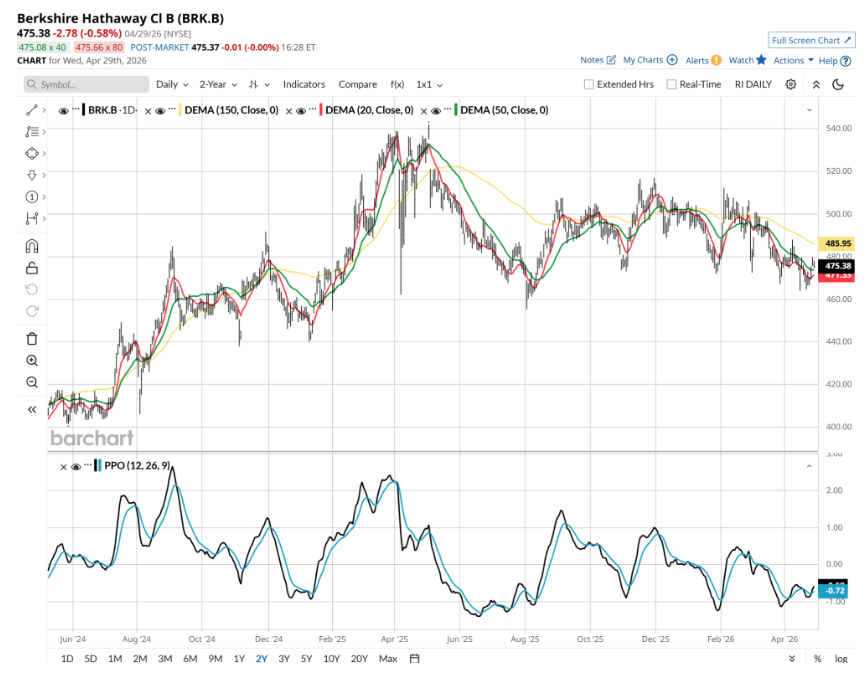 Berkshire's giant cash pile makes it a safe bet.
 Mastercard (MA) is next, and the logical question would be, “why not Visa instead?” Frankly, they trade very much in tandem, so if you like V for victory (or Victor Collazo), have at it.
What I like about MA is at least the effort the price is making to take another run toward the $600 mark, where it peaked twice last year.
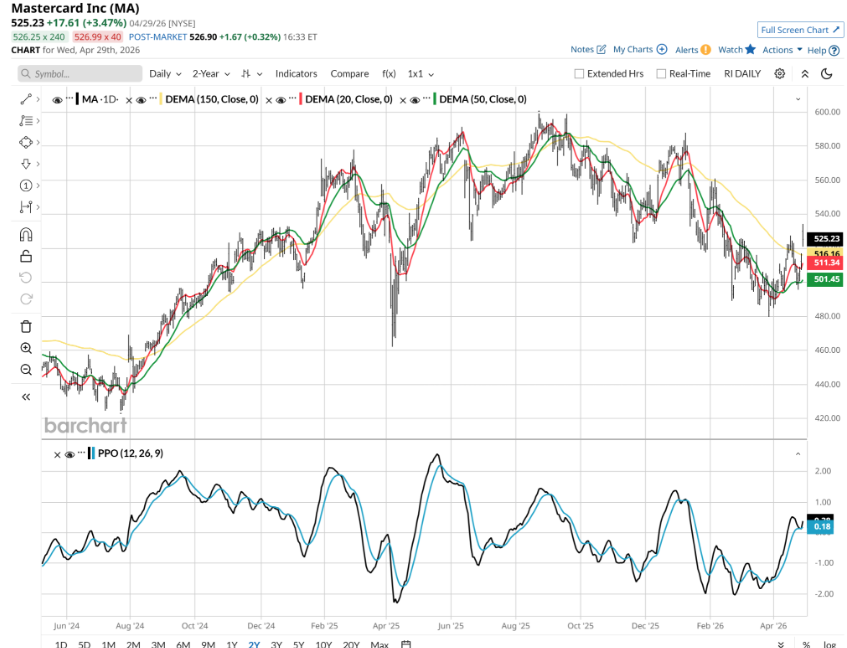 MA is making a run for $600.
 The PPO indicator shows it has a chance, having just flipped to positive. This is akin to a horse breaking out of the pack. We can only see MA’s nose and head busting through, but there could be some kick to this one.
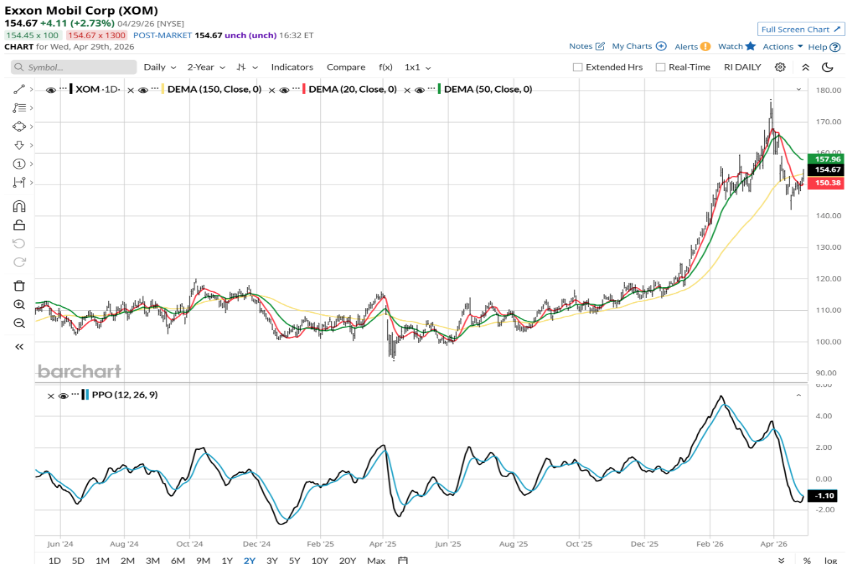
Finally, there’s a contender who trots up to the starting gate to the faint sounds of Darth Vader’s Imperial March swelling in the background: an energy stock. I say that because Exxon Mobil (XOM) and its sector going up this year has coincided with the rest of the market falling as energy prices spike. Thank the Iran War for that.
 Did they have horses on the Death Star?
 XOM’s chart reminds me of a horse coming down the stretch, riding the rail the whole way. If there’s a horse blocking it, it might not get through and will not be a factor to “hit the board” (top three finishers) when the race ends. When we consider that the “blockage” of the Strait of Hormuz is now the top story relating to that quagmire, the whole analogy comes together. A triple crown of sorts.
However, if the jockey is able to spot an opening and get through it in time, the horse could sprint to the finish and end up in the winner’s circle. For the horse who wins the Kentucky Derby this Saturday as the skies darken over Louisville, he’ll get a big batch of roses for the effort.
So, that’s the scouting report for the 152nd Kentucky Derby, and a quick look at my rationale for combining two things I have developed strong ties to. One as a teen (investing), the other after age 40.
And oh, by the way, I’ll go with 6-14-2 (Commandment-Potente-Albus) as my Derby picks. Those are the post positions that correspond to the trio of stocks I highlighted above as potential winners. Because after this article, how could I not?
Enjoy the Derby!
Rob Isbitts created the ROAR Score, based on his 40+ years of technical analysis experience. ROAR helps DIY investors manage risk and create their own portfolios. For Rob's written research, check out ETFYourself.com.
On the date of publication, Rob Isbitts did not have (either directly or indirectly) positions in any of the securities mentioned in this article. All information and data in this article is solely for informational purposes. For more information please view the Barchart Disclosure Policy here.
More news from Barchart
These 3 Charts Look Like Thoroughbreds: Get Derby-Ready With My Racetrack-to-SPY Roadmap Let’s Get This Strait: Ignore Energy Prices at Your Own Peril (and 3 ETFs to Buy Now) Dozens of Experts Built This Simple Stock Screener for Traders & Investors. It Was Me. Semiconductor Stocks Are the New Elephant in the Room at 14% of the S&P 500. How to Play This Tech Super-Sector.