


Skyward Specialty Insurance Group, Inc. SKWD delivered a solid first quarter of 2026, with operating earnings per share of $1.25, increased 38.9% from a year ago and beat the Zacks Consensus Estimate of $1.05. Total revenues were $475.87 million, up 44.8% year over year, and came in 19.4% above the consensus mark.
First quarter performance reflected stronger premiums, underlying underwriting results alongside the accretive impact of Apollo, while profitability held firm with a lower combined ratio.
Skyward Specialty Insurance Group, Inc. Price, Consensus and EPS Surprise
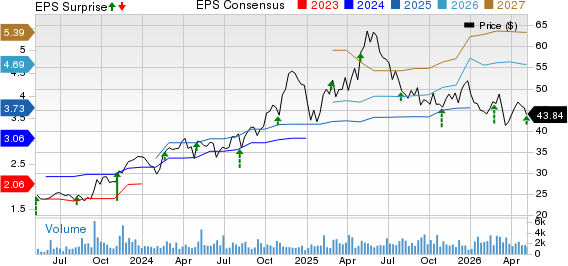
Skyward Specialty Insurance Group, Inc. price-consensus-eps-surprise-chart | Skyward Specialty Insurance Group, Inc. Quote
SKWD’s Premium Base Expanded Across Both Platforms
Gross written premiums totaled $667.7 million, up 9.9% versus the prior-year period. Growth was broad-based, led by an 8.7% increase in the Skyward Specialty segment and an 18.7% rise in the Apollo segment, supported by higher volume in syndicate 1969.
Net earned premiums climbed to $434 million from $300.4 million a year ago, reflecting higher business volumes and the expanded footprint following the Apollo consolidation. Underwriting fee income of $10.1 million also contributed to the quarter’s top-line mix, tied to Apollo’s managing agency activities.
Net investment income increased to $27.1 million from $19.4 million a year ago, driven by the addition of the Apollo portfolio, a higher yield environment, and a larger invested asset base.
Skyward Group’s Underwriting Mix Drove Growth
Within Skyward Group’s U.S. specialty operations, several underwriting divisions posted notable momentum. Accident & Health gross written premiums increased 45.7% year over year, Credit & Surety rose 42.5%, Global Agriculture advanced 27.0%, and Specialty Programs jumped 51.2%, helping offset declines in Energy Solutions and Global Property.
The portfolio’s evolving composition also reflected a sharper emphasis on businesses positioned for steadier growth. Management highlighted continued diversification, including expansion in areas with lower exposure to property-and-casualty underwriting cycles, as it aims to sustain disciplined top-line and bottom-line progress.
SKWD’s Expenses
Losses and loss adjustment expenses were $265.22 million, up from $187.31 million in the prior-year quarter, in line with the larger premium base. Still, the total loss ratio improved to 61.1% from 62.4% a year ago, supporting underwriting profitability despite business-mix shifts within the Skyward Specialty segment. Total Cat loss and LAE of 1.8% declined from 2.2% a year ago.
Underwriting, acquisition and insurance expenses rose to $124.6 million from $86.6 million a year ago, reflecting higher activity levels and a larger operating platform. On the ratio side, net policy acquisition costs improved to 13.9% from 14.8% in the year-ago quarter, pointing to operating leverage as premium volume expanded.
The combined ratio of 89.5% decreased from 90.5% a year ago.
SKWD’s Financials (As of March 31, 2026)
On the balance sheet, cash and cash equivalentsrose to $255.9 million at first-quarter end, from $168.5 million at 2025-end. Total assets reached $6.55 billion as of March 31, 2026, up from $4.79 billion at 2025-end.
Notes payable jumped to $466.4 million from $100.4 million at 2025-end.
Book value per share of $27.50 in the first quarter increased from $24.92 a year ago.
Skyward Specialty currently has a Zacks Rank #4 (Sell).
You can see the complete list of today’s Zacks #1 Rank (Strong Buy) stocks here.
How Did Other Insurers Perform?
Companies like The Hartford Insurance Group, Inc. HIG, RenaissanceRe Holdings Ltd. RNR and The Allstate Corporation ALL have also reported earnings for the March quarter. Here’s how they have performed:
Hartford posted first-quarter 2026 core earnings per share of $3.09, up 40.5% from $2.20 in the prior-year quarter, but missed the Zacks Consensus Estimate of $3.29. Less favorable prior-year reserve development, higher expenses and pressure in Employee Benefits affected results. The negatives were partially offset by high demand for expensive risk events, stronger investment income and a massive turnaround in Hartford’s Personal Insurance.
RenaissanceRe reported first-quarter 2026 operating income of $13.75 per share, which surpassed the Zacks Consensus Estimate by 24.2% and improved from the year-ago quarter’s operating loss of $1.49. The quarterly earnings were aided by a decline in expenses and strong underwriting performance in both segments. RenaissanceRe’s improved combined ratio and fee income also contributed to the upside.
Allstate reported a first-quarter 2026 adjusted net income of $10.65 per share, which outpaced the consensus estimate by 43.3% and surged 201.7% year over year.Results were driven by higher property and casualty insurance premiums, improved net investment income and lower catastrophe losses. Lower expenses and strong underwriting performance further aided Allstate’s results.
Beyond Nvidia: AI's Second Wave Is Here
The AI revolution has already minted millionaires. But the stocks everyone knows about aren't likely to keep delivering the biggest profits. AI’s second wave is moving from infrastructure to implementation and these companies are at the forefront of this transition, positioned to become what Amazon and Google were to the internet era.
See Stocks Now >>Want the latest recommendations from Zacks Investment Research? Today, you can download 7 Best Stocks for the Next 30 Days. Click to get this free report
The Hartford Insurance Group, Inc. (HIG): Free Stock Analysis Report
RenaissanceRe Holdings Ltd. (RNR): Free Stock Analysis Report
The Allstate Corporation (ALL): Free Stock Analysis Report
Skyward Specialty Insurance Group, Inc. (SKWD): Free Stock Analysis Report
This article originally published on Zacks Investment Research (zacks.com).