


The big ‘news’ Monday morning is that Washington and Ottawa are gearing up for an “all-out trade war”.
Meanwhile, Russia's War on Ukraine and the US president's War on Iran (and nearly everywhere else) made minor headlines.
Join 200K+ Subscribers: Find out why the midday Barchart Brief newsletter is a must-read for thousands daily.
The big mover was King Corn as investment money continues to pour in for a number of reasons, some of them having to do with real supply and demand.
Morning Summary: As I watched the markets open Sunday evening and night, two in particular stood out to me: Corn and Wheat. While I’ll talk about the Grains sector in more detail momentarily, connecting the dots of these two markets posting double-digit gains shortly after the open indicated Russia’s War on Ukraine likely intensified Sunday into Monday. A quick search of the headlines and all I found was Ukraine’s Zelensky claimed Russia’s Vlad the Invader was drafting 300,000 more troops to “seize territory”. As for Vlad the Invader Lite, the US president continued to throw threats of economic sanctions at Iran, all while, as another headline reads, the “Canadian dollar slides as Ottawa and Washington head for all-out trade war”. Speaking of the Loonie (CADUSD), one has to wonder when this lunacy will end before the adults take charge again. In other news, despite the US president’s ongoing War on Iran, the Energies sector was under pressure to start the week. WTI crude oil was off $1.70 at this writing with diesel fuel down 11.5 cents. Over in Metals we see gold (GCZ26) up a quiet $10 while silver (SIZ26) slipped 93.0 cents (1.3%) at this writing. US stock index futures were lower, following through on last week’s lower close.
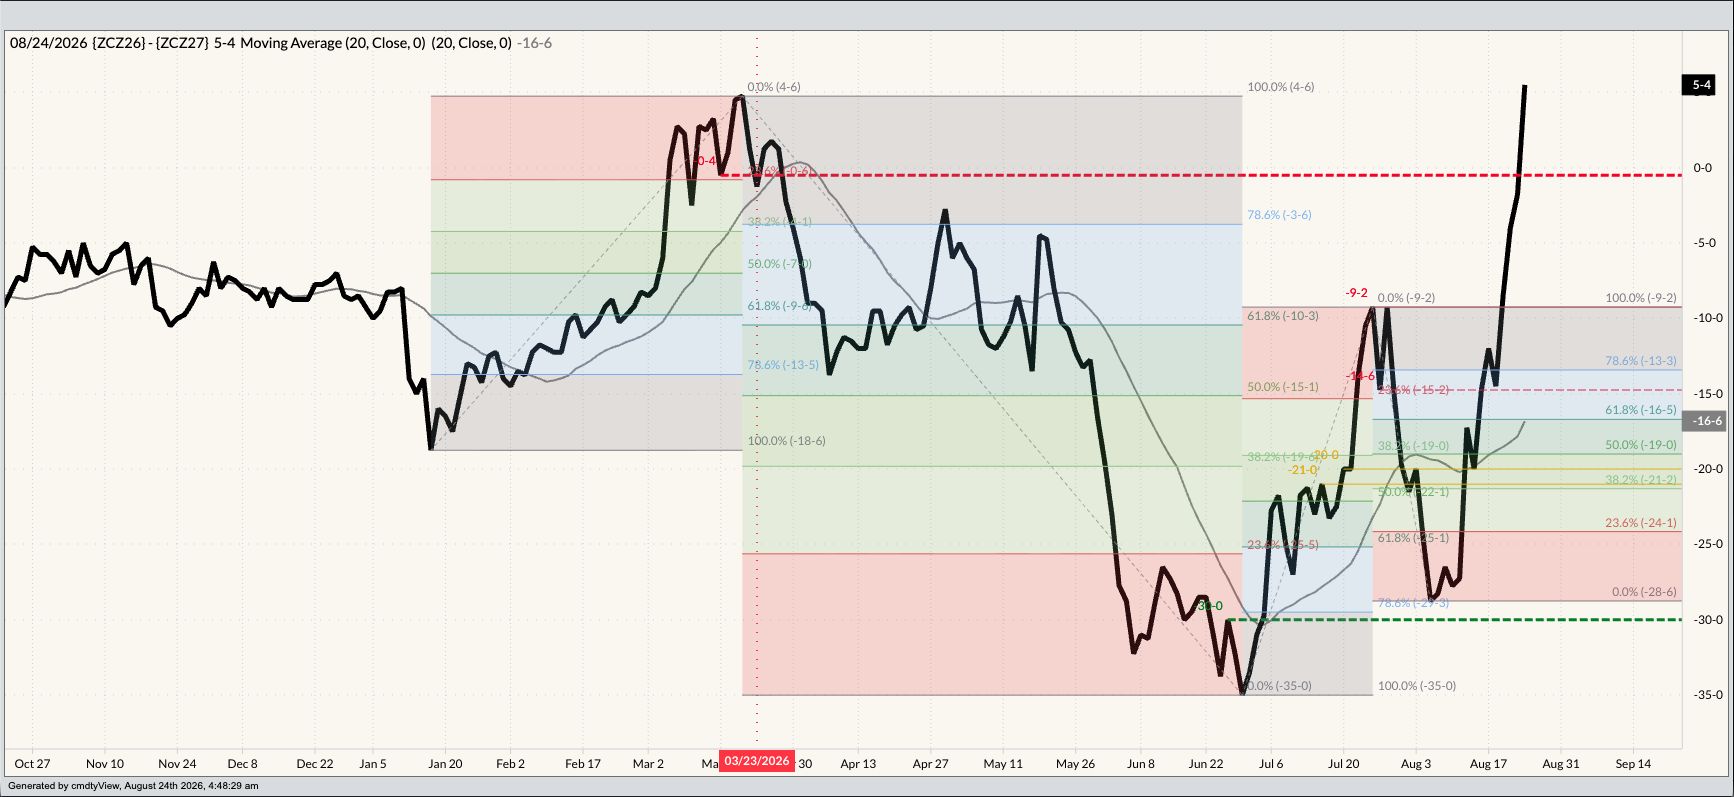
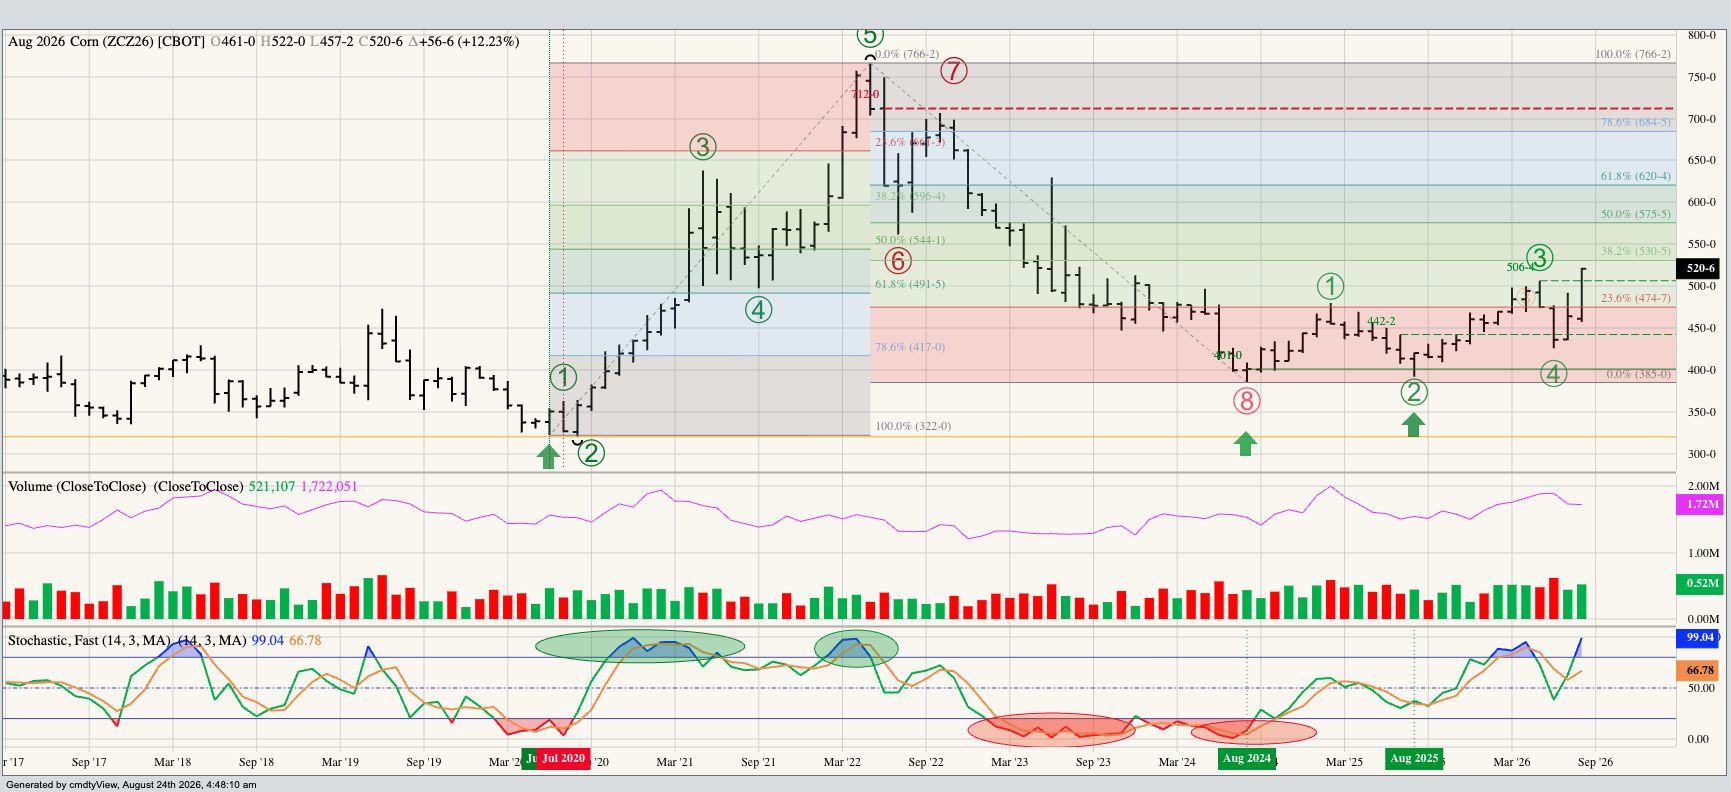
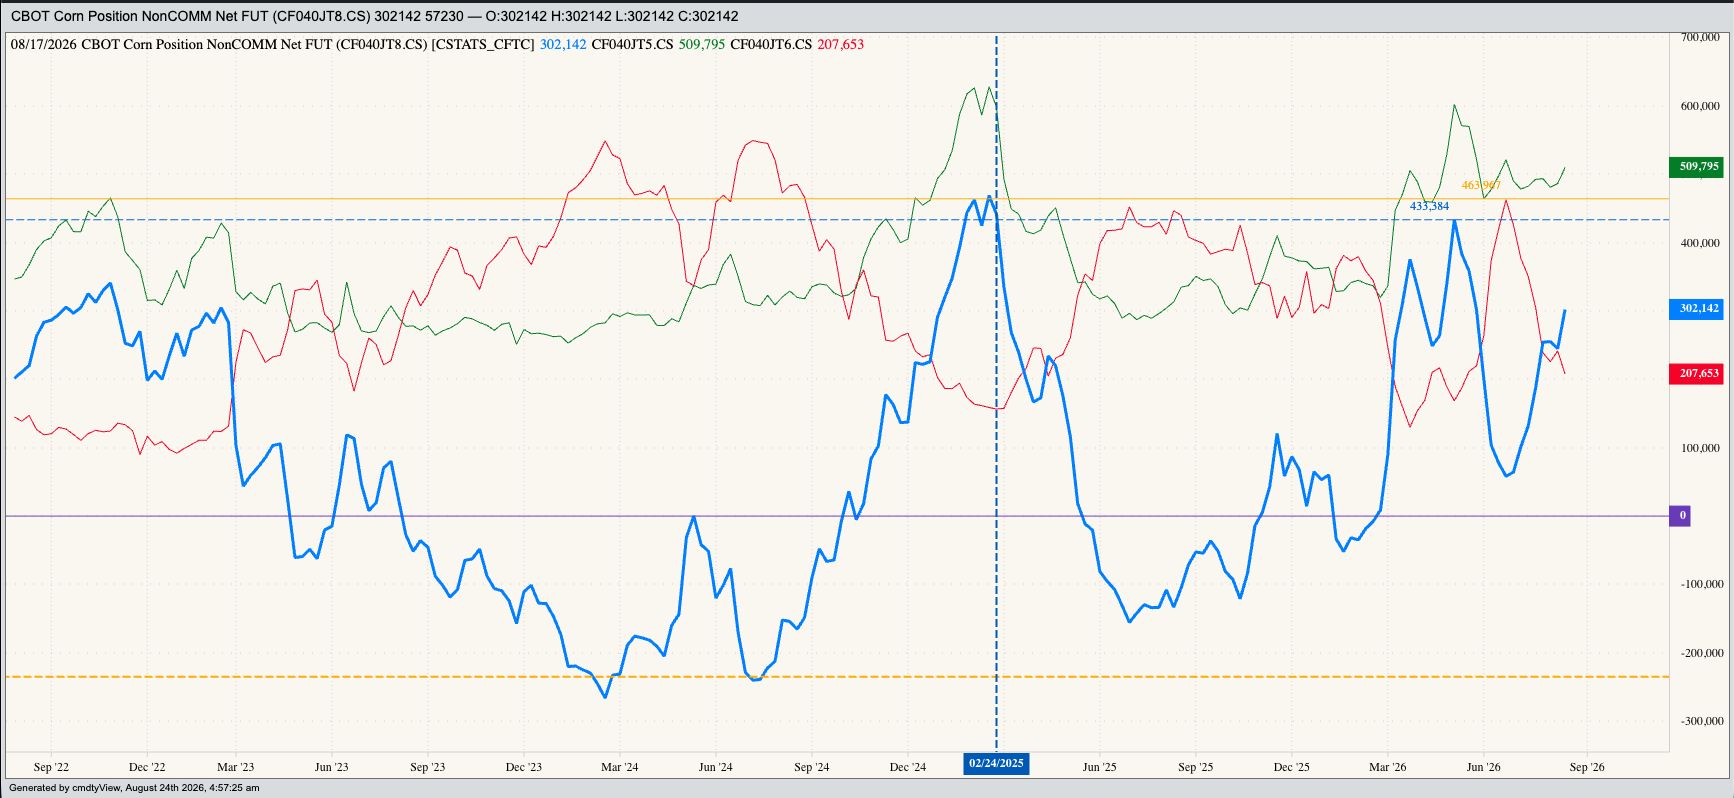
Corn: Let’s talk about the corn market. The December issue (ZCZ26) gained as much as 13.5 cents overnight on trade volume of 128,000 contracts and was sitting 12.25 cents higher at this writing. Dec26 extended the long-term rally on the monthly chart for Dec corn only to a high of $5.22, up 58.0 cents (12.5%) for the month, and 66.0 cents (14.5%) for 2026. That’s impressive on any timeframe and made more so when we add in Dec26 has rallied 96.25 cents (22.6%) since its late June low of $4.2575. What is driving the rally? The noncommercial net-long futures position has gone from 58,333 contracts in late June to 302,142 contracts as of Tuesday, August 18. Meanwhile, the Dec26-Dec27 futures spread rocketed to an inverse of 5.25 cents overnight, a long way off its carry of 28.75 cents at the close of August 5. What has been the catalyst for all this fund buying? Some will chime in with “bullish” USDA numbers while others will point to last week’s Crop Tour final guess of 173.2 bushels per acre for national average yield. The reality is the May-July futures spread has been bullish since at least last March, growing more so since late June, and moving to a small inverse overnight through Monday morning.
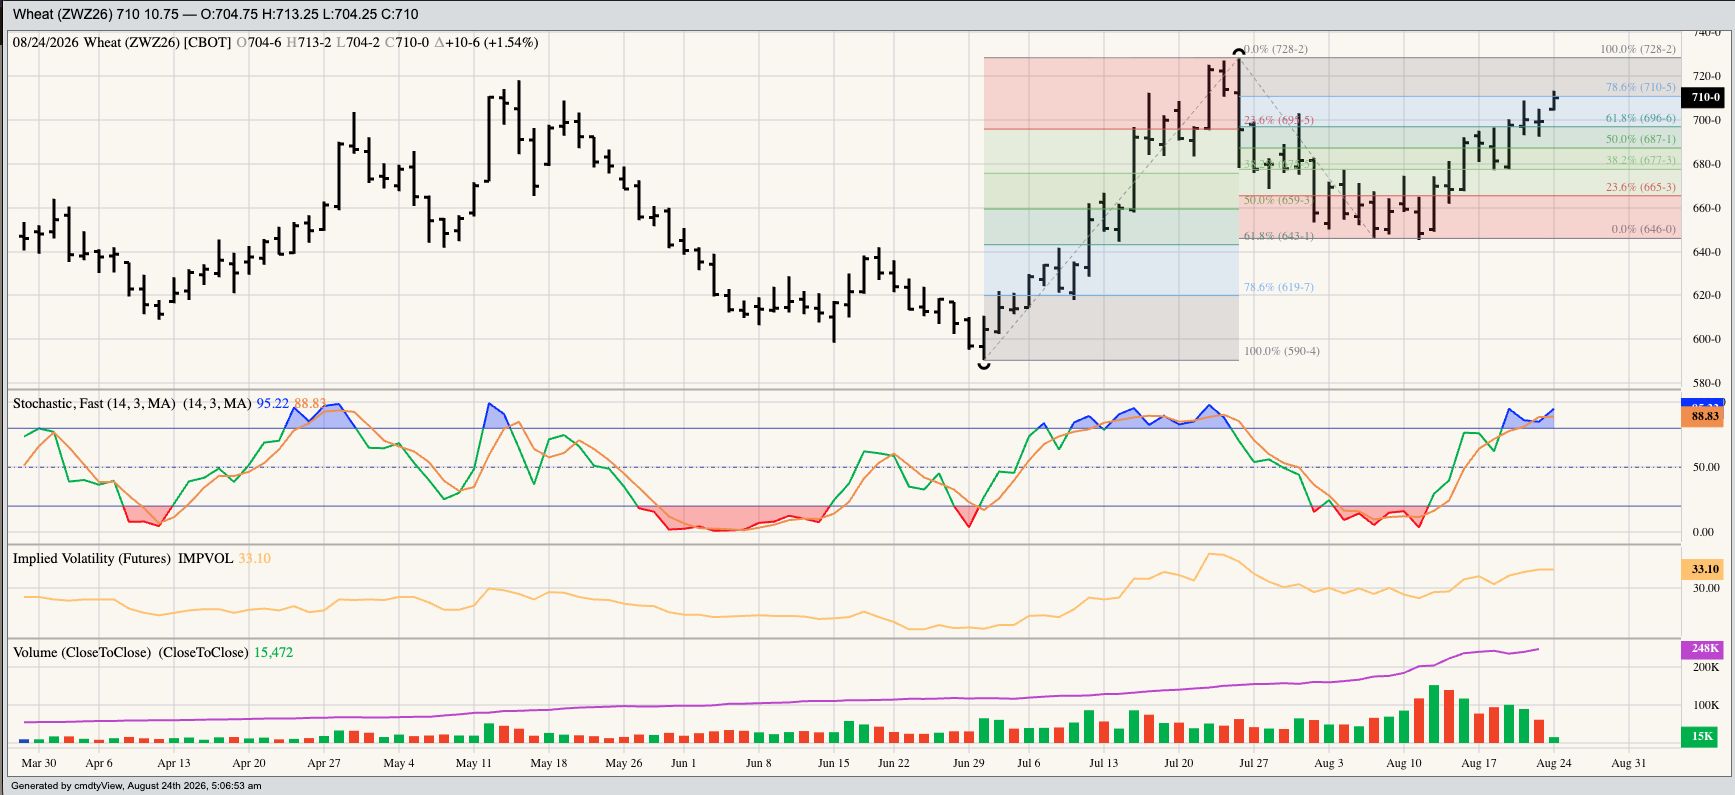
Wheat: As mentioned in the opening Summary, the wheat sub-sector was also in the green to start this last full week of the summer season. The December SRW issue (ZWZ26) rallied as much as 14.0 cents overnight on trade volume of 15,500 contracts. Dec hit a high of $7.1325, its highest price since posting an impressive bearish technical reversal on July 24, though now looks to be technically overbought. A look back at last Friday’s latest Commitments of Traders report, for the week ending Tuesday, August 18, and it is understandable if one was surprised by SRW’s numbers. The net futures position was still short at 18,765 contracts, a decrease of only 6,145 contracts, despite the December issue closing the Tuesday-to-Tuesday positioning week with a gain of 33.0 cents. From last Tuesday’s close of $6.8125 through early Monday morning, Dec26 is up another 28.5 cents. Is the buying coming from the commercial side rather than Watson? The Dec-March futures spread closed covering a bearish 71% calculated full commercial carry last Friday, completing a Down Escalator Simulator give the September-December spread also covered 71%. Meanwhile, national average basis versus December weakened by 1.75 cents from week to week. For now it looks to be a case of wheat being wheat.
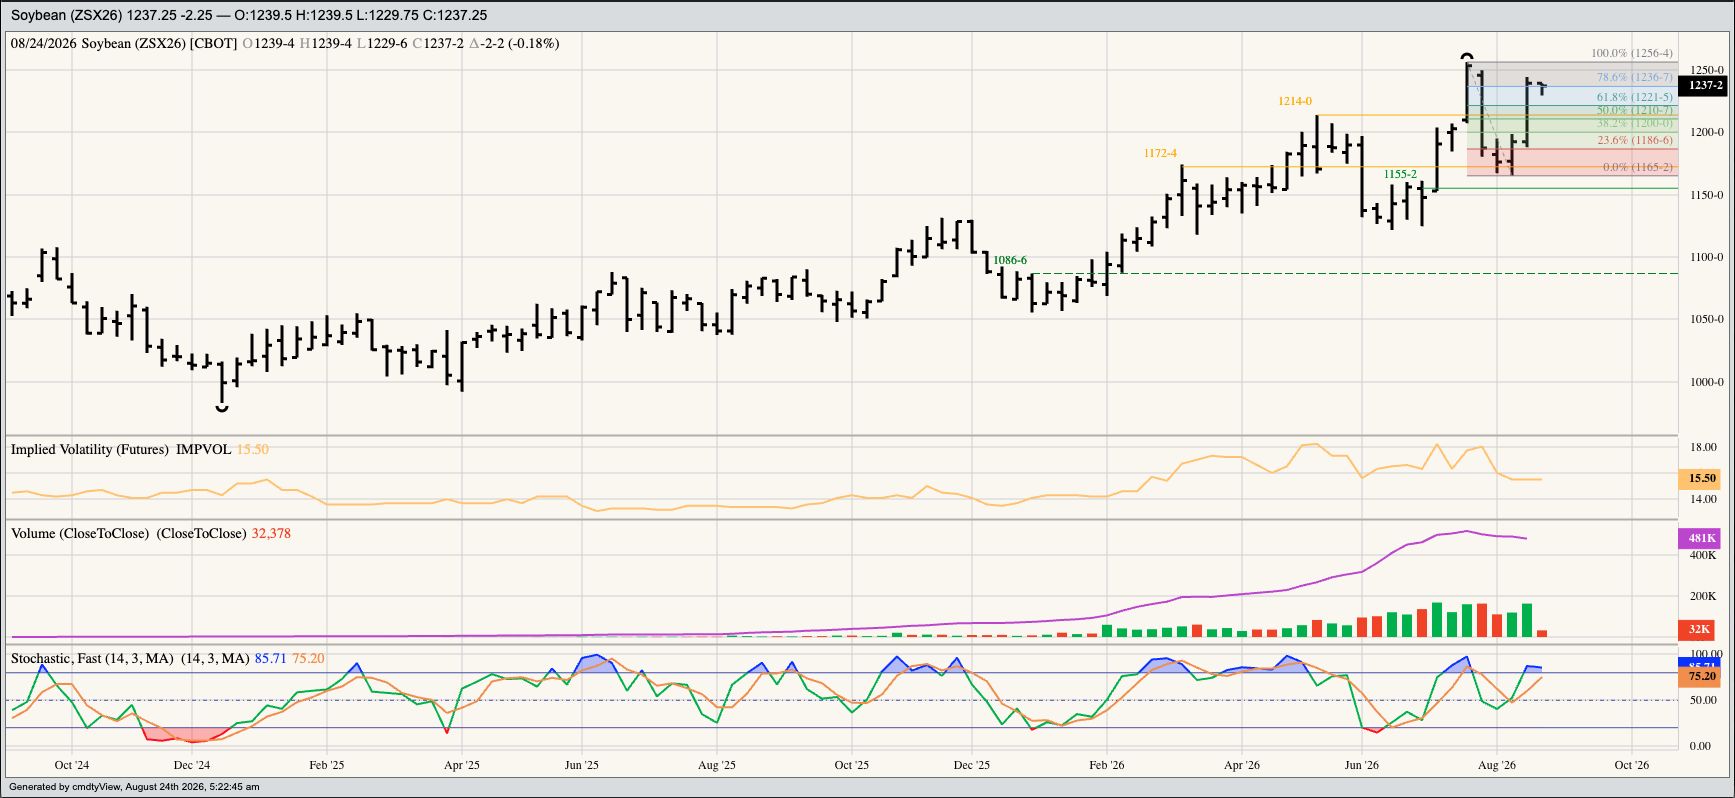
Soybeans: Last and certainly least, at least for this trip around the clock, is the soybean market. Here we see the November issue (ZSX26) lost as much as 9.75 cents overnight before spillover buying from corn and wheat trimmed its loss to 2.0 cents as of this writing, all on trade volume of 33,000 contracts. Taking another look back at last Friday and we see there was support from commercial buying to close out the week as the Nov-January futures spread covered a straight-up neutral 50% calculated full commercial carry as compared to the previous Friday’s settlement covering 54%. Further out, the Brazil-led March-May futures spread covered 16% versus the previous week’s 22%. This continues to indicate the bulk of the concern, fundamentally speaking is with Brazil’s 2027 crop. Still, national average basis firmed against November futures, finishing the week at 38.25 cents under as compared to the previous Friday’s figure of 41.0 cents under. The previous 5-year average weekly close for the first week of September is 44.0 cents under November. From a technical point of view, it could still be argued Nov26 is in a short-term downtrend on its daily chart, despite higher closes posted last Thursday and Friday.
On the date of publication, Darin Newsom did not have (either directly or indirectly) positions in any of the securities mentioned in this article. All information and data in this article is solely for informational purposes. For more information please view the Barchart Disclosure Policy here.
More news from Barchart
Why This Week Looks to Be Fun 1 Trade to Make as the Pro Farmer Crop Tour Wraps Up What Will Watson Do Wednesday? Wheat Prices Have Risen- How High Can They Go?