
XAUUSD H4 — Technical Outlook 📊
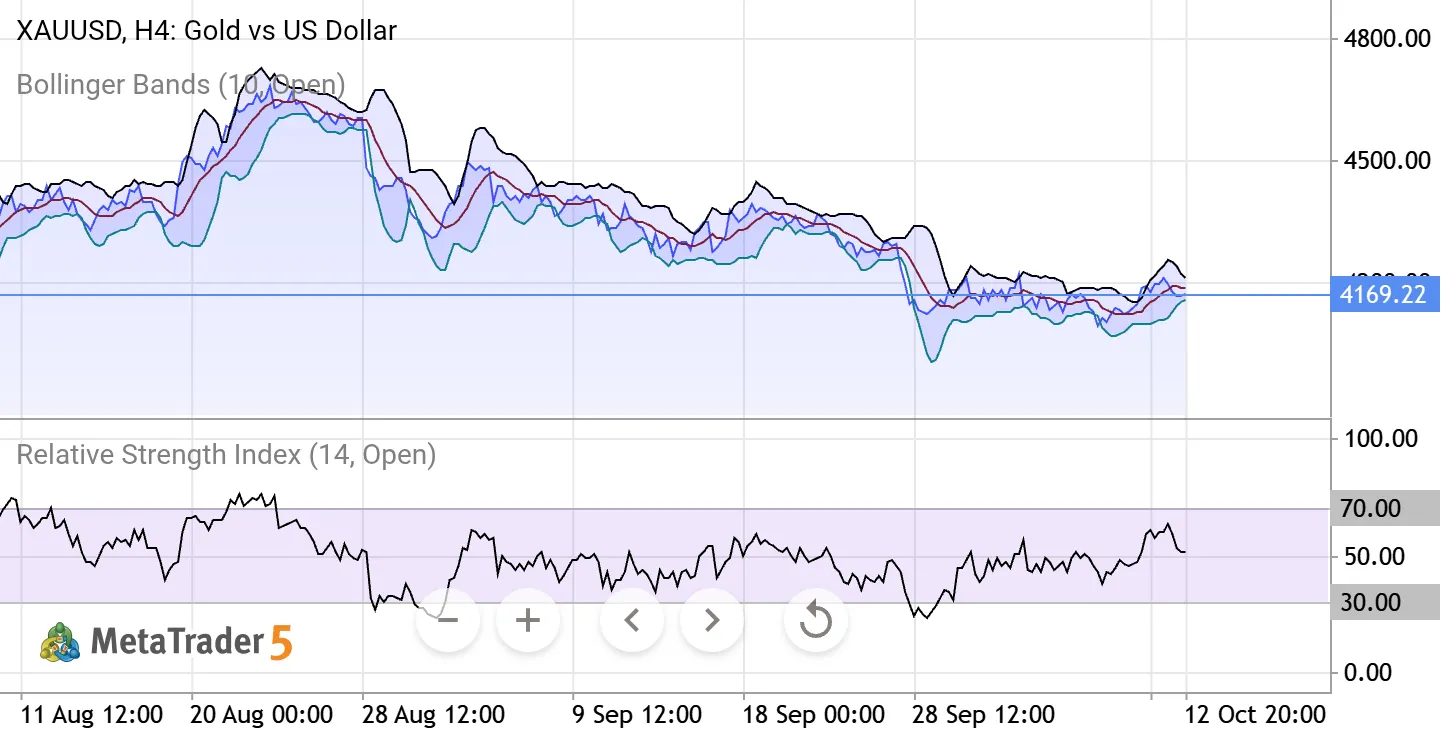
Gold is currently trading around 4169, with price moving near the middle area of the Bollinger Bands. The market has recently shown a recovery from the lower Bollinger Band, but momentum remains mixed.
The Bollinger Bands are relatively compressed, suggesting a potential expansion in volatility ahead. A sustained move above the 4200–4220 area could strengthen bullish momentum and open the way toward higher resistance levels.
On the other hand, rejection from the upper band or failure to hold the current structure could bring price back toward 4140–4100 support.
The RSI is around the mid-50s, showing that momentum is neither overbought nor oversold. This leaves room for movement in either direction, so confirmation from price action is important before taking a position.
Bullish confirmation: Break and hold above 4200–4220.
Bearish confirmation: Rejection from resistance and break below 4140.
Key focus: Wait for Bollinger Band breakout + RSI confirmation before entering.
Educational analysis only — Not financial advice.

 MQL5プロファイル
新しいコメント
Wow that's great analysis I appreciate