スクリーナー

#過去7日
1
NVDA
NVIDIA Corporation - Common Stock
207.41 USD0.00%+1.46%-9.75%+44.02%5.02 T USD
2
GOOGL
Alphabet Inc. - Class A Common Stock
373.25 USD0.00%+2.83%-5.71%+112.10%4.52 T USD
3
AAPL
Apple Inc. - Common Stock
299.24 USD0.00%+2.91%-0.33%+52.71%4.40 T USD
4
MSFT
Microsoft Corporation - Common Stock
393.83 USD0.00%-1.15%-5.35%-17.61%2.93 T USD
5
AMZN
Amazon.com, Inc. - Common Stock
246.00 USD0.00%+0.98%-6.77%+14.37%2.65 T USD
6
TSM
Taiwan Semiconductor Manufacturing Company Ltd
425.89 USD0.00%+2.92%+4.67%+98.37%2.21 T USD
7
AVGO
Broadcom Inc. - Common Stock
376.71 USD0.00%-1.26%-10.60%+50.15%1.79 T USD
8
META
Meta Platforms, Inc. - Class A Common Stock
600.21 USD0.00%+3.35%-1.48%-14.01%1.52 T USD
9
TSLA
Tesla, Inc. - Common Stock
404.66 USD0.00%+3.39%-3.51%+27.53%1.52 T USD
10
MU
Micron Technology, Inc. - Common Stock
1020.76 USD0.00%+12.76%+36.02%+747.60%1.15 T USD

ヒートマップ

チャート&アイデア

IWM - Daily Trading Forecast
I
IWM iShares Russell 2000 ETF
IWM - Daily Trading Forecast
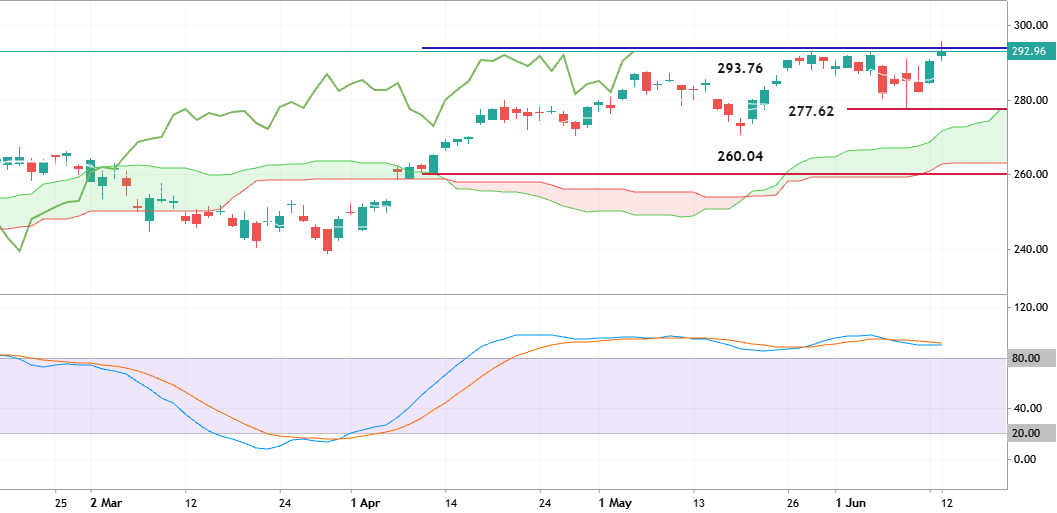
The daily price is located above Ichimoku cloud in the bullish area of the chart. Stochastic oscillator is showing the overbought market condition but the price is still trying to break the resistance level at 293.76 for the goood breakout. If the price breaks the resistance at 293.76 to above on daily close bar so the strong bullish trend will be resumed. If the price crosses 277.62 support to below so the primary bearish reversal may be started with the secoindary ranging way and with 260.04 as a good terget to re-enter. Alternatively, the price will be on ranging within s/r channel waiting for the direction of the strong trend to be started. Trading Summary : ranging; ready for the daily breakout
0
newdigital Sergey Golubev 2026.06.14 14:54
TTE - Daily Trading Forecast TTE Long TotalEnergies SE Ordinary Shares
TTE - Daily Trading Forecast
Daily price is located inside Ichimoku cloud for trying to cross the resistance level at 90.40 to above for the bullish trend to be resumed. If the price breaks resistance at 90.40 on the daily close bar so the bullish trend will be resumed with 94.17 resistance as the possible target. If the price crosses the support level at 85.30 so the daily bearish reversal will be started. Alternatively, the price will be on ranging waiting for direction. Trading Summary : ranging waiting for the bullish trend to be resumed.
2
newdigital Sergey Golubev 2026.06.11 17:43
GBPUSD TRADE IDEA GBPUSD Long Pound Sterling vs US Dollar
GBPUSD TRADE IDEA
GBPUSD H4 – Bias: 🟢 Bullish Price is moving inside an ascending channel after a strong rebound from the 1.3320 support zone . Buyers are testing the key resistance at 1.3416 . A breakout and close above 1.3416 could push GBPUSD toward 1.3470 and 1.3530 . Buy Setup Entry: Above 1.3416 Target 1: 1.3470 Target 2: 1.3530 Stop Loss: Below 1.3360 Bearish Risk Rejection from 1.3416 may lead to a pullback toward 1.3360 and 1.3320 . Conclusion: Short-term momentum remains bullish while price stays above 1.3360 . A confirmed breakout above 1.3416 favors further upside. 📈
0
HamadJatoi Hamad Jatoi 2026.06.10 13:49
XAUUSD TRADE IDEA XAUUSD Long Gold vs US Dollar
XAUUSD TRADE IDEA
Trade Analysis (H1 Chart) Market: Appears bearish overall. Current Structure Price is trading inside a descending channel . Strong bearish momentum pushed price from the 4350–4360 area down toward 4150 support . The latest candle has broken slightly below the lower channel boundary, suggesting possible exhaustion of the sell-off. Key Levels Support: 4150, then 4120. Resistance: 4220, then 4335. Bullish Scenario If 4150 support holds and buyers defend this zone, a corrective rally toward 4220 is possible. A break above 4220 could extend recovery toward the channel midline around 4250–4280 . Bearish Scenario If price closes decisively below 4150 , sellers remain in control. Next downside targets would be 4120 and potentially 4100 . Trading Bias Short-term: Oversold near support; watch for a
0
HamadJatoi Hamad Jatoi 2026.06.10 13:36
HOOD - Long-Term Technical Forecast HOOD Robinhood Markets, Inc. - Class A Common Stock
HOOD - Long-Term Technical Forecast
Weekly price is located near and below Ichimoku cloud in the bearish area of the chart. The symmentic pattern was formed with support level at 63.52 and resistance at 94.40. If the price breaks the support level at below on weekly close bar so the bearish trend will be resumed. If the price crosses the resistance level to above so the primary bullish reversal will be started with 124.31 resistance level as a final reversal target to re-enter. Alternatively, the price will be on secondary ranging to be inside s/r channel for direction. Trading Summary : ranging for direction - bearish trend to be resumed or the bullish reversal to be started.
0
newdigital Sergey Golubev 2026.06.08 17:31
xauusd h4 analysis XAUUSD Gold vs US Dollar
xauusd h4 analysis
XAUUSD | H4 Analysis Gold is showing a strong bullish breakout from a descending channel pattern. Price has successfully rejected support around 4440–4460 and is now pushing higher toward the upper resistance zone. 📈 Bullish Scenario: A sustained move above 4500 could open the path toward 4560–4600. 📊 Key Levels: Support: 4440 – 4460 Resistance: 4560 – 4600 Outlook: Buyers remain in control while price holds above the breakout area. Momentum favors further upside continuation. 🚀
7
Goldanalysisteam Abdul Qayoom 2026.06.04 08:00
GBPUSD TRADE IDEA GBPUSD Long Pound Sterling vs US Dollar
GBPUSD TRADE IDEA
Entry: 1.3415 – 1.3430 Stop Loss: 1.3390 (below support) Take Profit 1: 1.3470 Take Profit 2: 1.3525 Reasoning Price is holding above the key support zone around 1.3400–1.3415 . Multiple rejections from lower levels suggest buyers are defending the area. Resistance remains near 1.3470 , offering a reasonable short-term upside target. Trade Bias ✅ Short-term Buy while price remains above 1.3400 . If an H4 candle closes below 1.3400 , invalidate the buy setup and look for selling opportunities toward 1.3365 .
1
HamadJatoi Hamad Jatoi 2026.06.04 07:56
Nasdaq 100 Linear Regression Channel Analysis
TEC
USTEC US Tech 100 Index
Nasdaq 100 Linear Regression Channel Analysis
**[Nasdaq 100 Linear Regression Channel Analysis Summary]** --- ### 1. Review of the Late March Buy Signal * **Event:** Price broke below the lower channel boundary (-2SD) and then re-entered ➔ **BUY Signal Confirmed**. * **Result:** Mean reversion triggered at the statistical bottom, fueling a powerful 2-month uptrend. ### 2. Current Upper Breakout & Why No Signal Has Appeared * **Event:** Price is surging past the upper channel line (+2SD), yet no sell arrow has printed. * **Reason:** The system triggers a sell signal only when the price **breaks back down inside** the upper boundary, not simply when it touches or exceeds it. * **Interpretation:** The absence of a signal means the market is in a state of **extreme bullish momentum (trend extension)**, rising faster than the channel's
0
EricYosi Koo Hotbeom 2026.06.03 17:39