 BTCUSD Bitcoin vs US Dollar
 BTCUSD TRADE IDEA
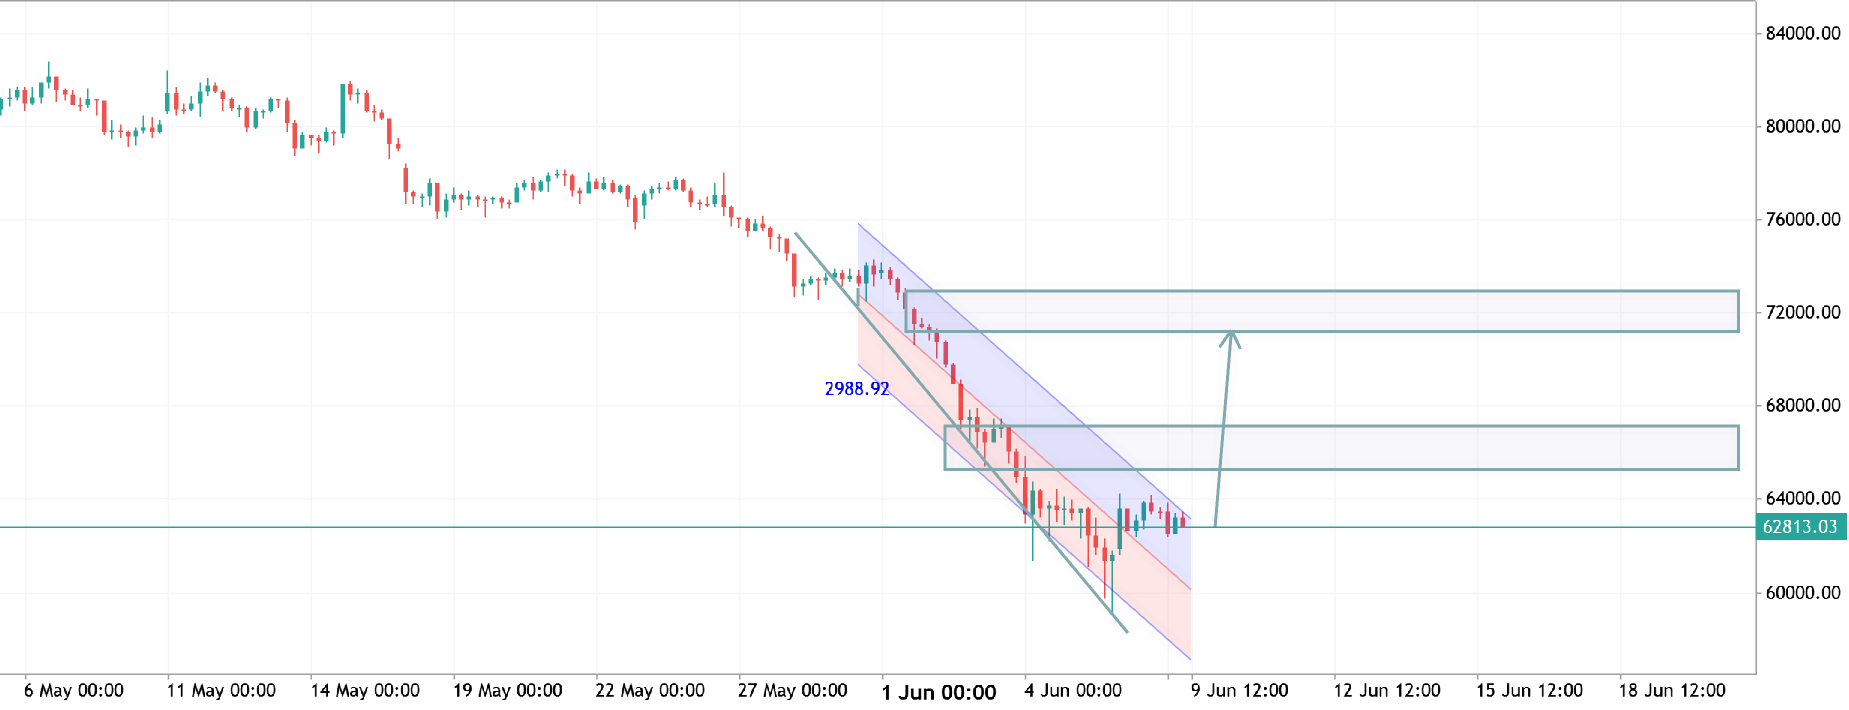
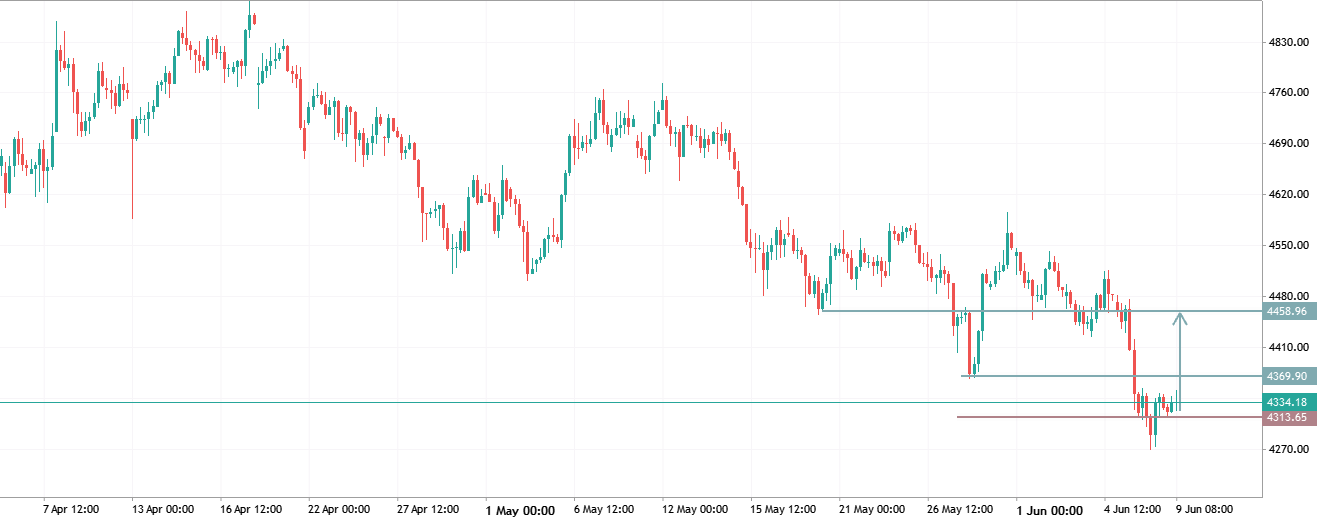
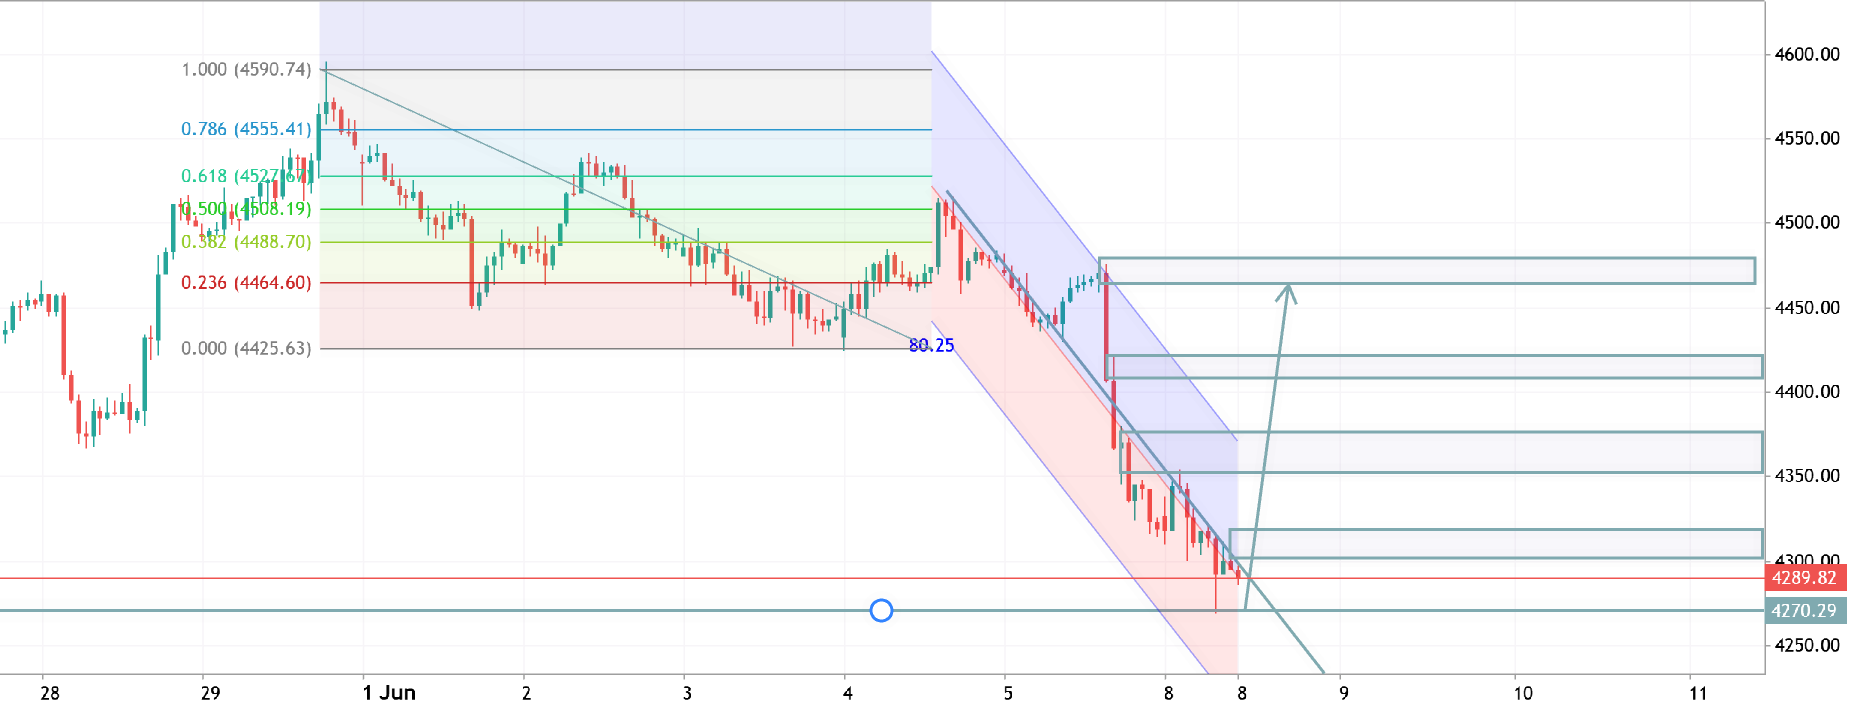
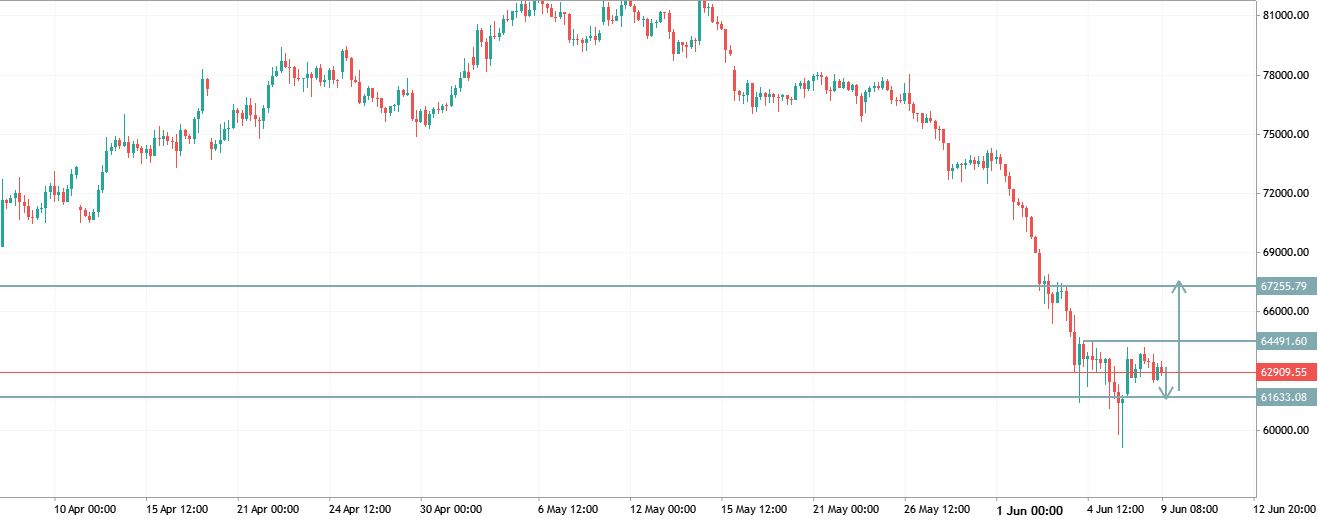
Market Structure: Bearish The chart shows a strong downtrend with consecutive lower highs and lower lows. Heavy selling pressure pushed price from the 81,000 area down toward 61,000–63,000. Recent price action is moving sideways after the sharp drop, indicating consolidation rather than a confirmed reversal. Key Levels Resistance 1: 64,491 Resistance 2: 67,256 Support 1: 61,633 Current Pivot: 62,845 Bullish Scenario A H4 candle close above 64,491 could trigger a recovery move. Target zones: 67,256 Higher resistance if momentum continues. Bearish Scenario Failure to break 64,491 and a close below 61,633 would favor trend continuation. Sellers could target fresh lows below the recent swing low. Trading Idea Buy Setup: Above 64,491 after a confirmed breakout. TP1: 67,256 SL: Below 61,633
0