
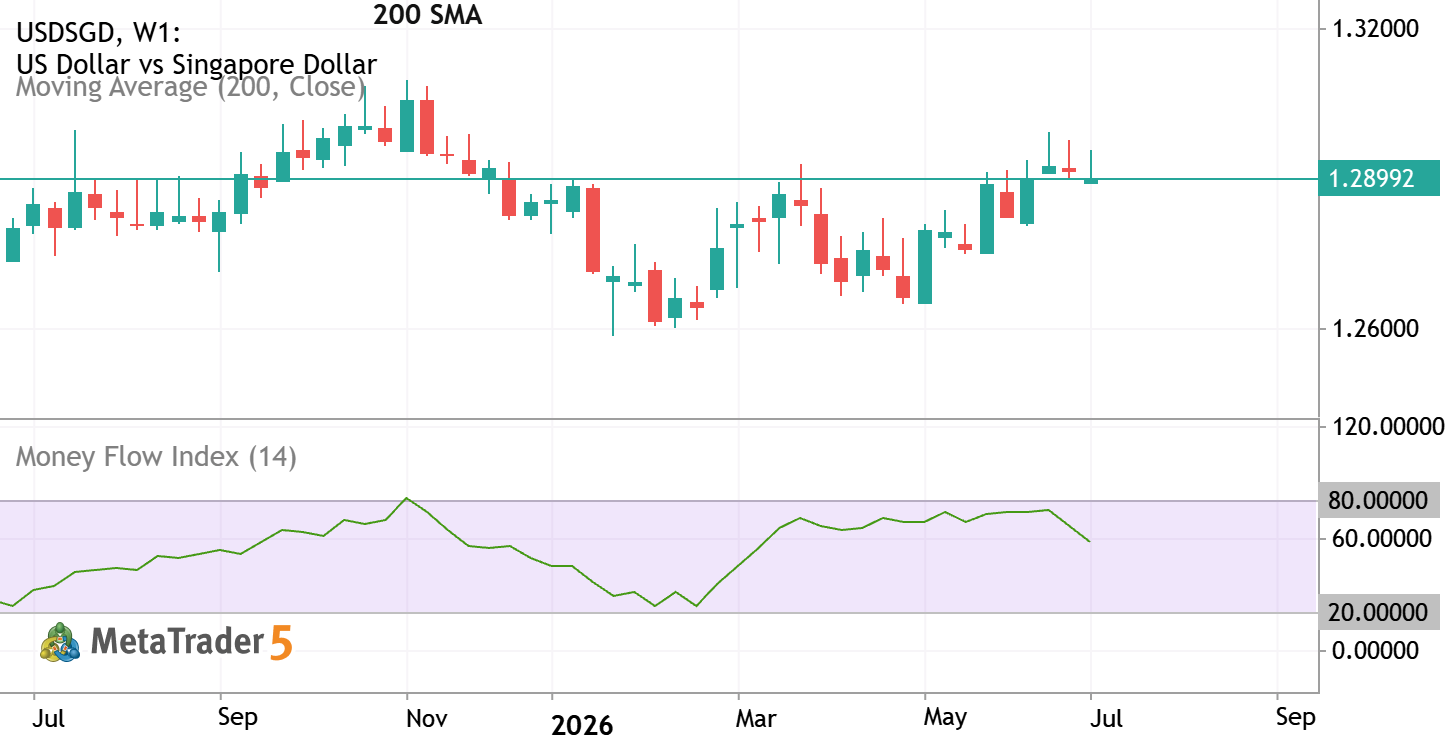
Money Flow Index (MFI) is a momentum indicator that measures the rate at which money is invested into or withdrawn from a security.
Traditional general approach to use MFI is the using it as the Trend Filter:
MFI (14) + Simple Moving Average (SMA with period 200) on the price chart.
- Buy Rule (Long): price is above the SMA. Wait for the MFI to drop below 20 (oversold) and start rising.
- Sell Rule (Short): price is below the SMA. Wait for the MFI to rise above 80 (overbought) and start falling.
Traders often monitor these zones for potential price peaks or bottoms.

 MQL5プロファイル
新しいコメント