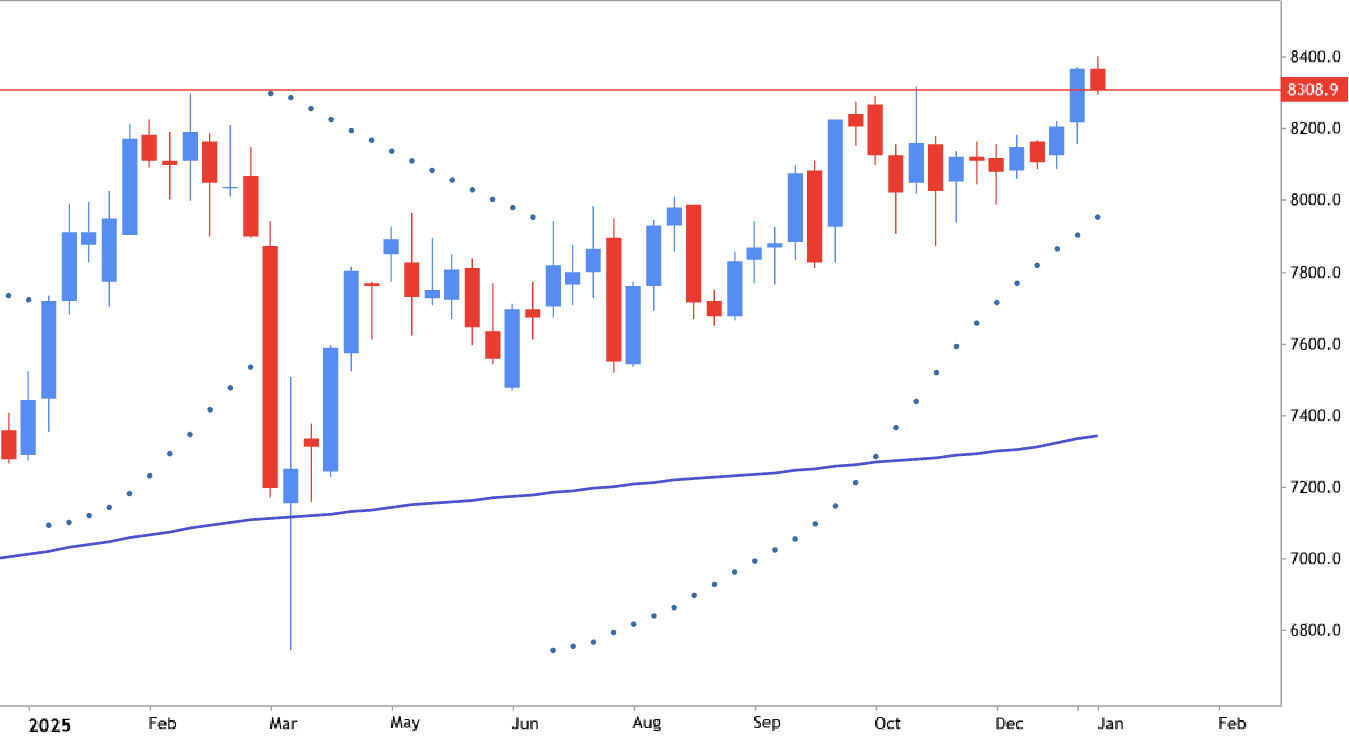
Parabolic SAR is something as "stop and reversal system", and it is shown as the series of dots placed either above or below the price on a chart. If the dot is located below the price so it means the bullish trend, and if dot is above the price so it is the bearish trend in that moment. So, this indicator is providing some kind of direction of the trend, and, besides, it allows us to set stop loss and to define the reversal of the price movement. Many traders are using this indicator together with SMA indicators for example: 55 SMA in intra-day basis, 100 SMA and 200 SMA.
2026.01.15 17:11
0

新しいコメント