
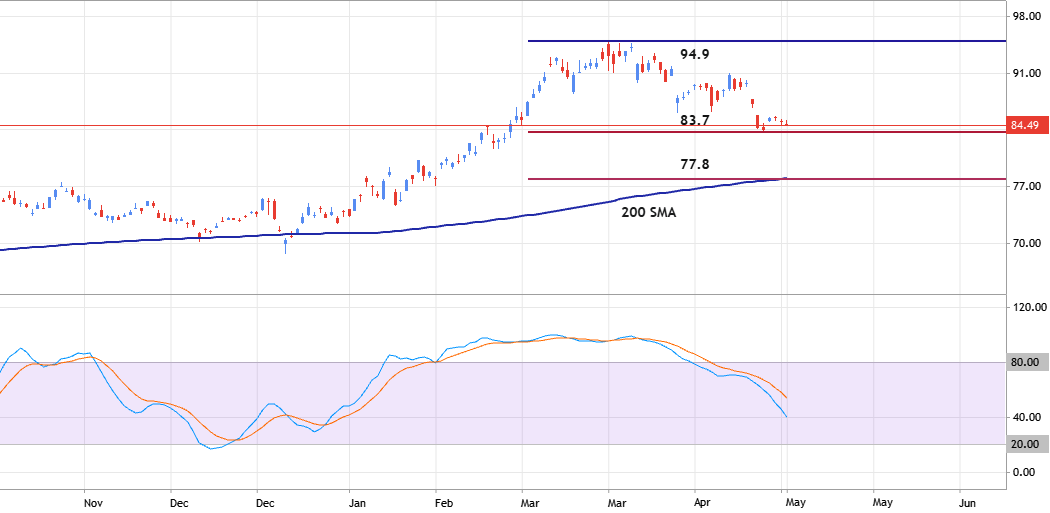
Daily price is located above 200 SMA in the bullish area of the chart. The price was bounced from 94.9 resistance level to below for the secondary correction to be started and with Stochastic oscillator to be confirmed this short term trend for example.
For now, the price is trying to break the descending triangle pattern with support level at 83.7 for the correction to be continuing up to the bearish reversal support level at 77.8. Alternatively, the price will be on the secondary ranging within s/r levels of the primary bullish trend waiting for the direction of the strong bullish trend to be continuing in the case of resistance level at 94.9 to be broken to above or to the primary bearish reversal to be started with 77.8 support level to be crossed to below on the close daily bar for example.
Trading Summary: secondary correction within the primary daily bullish trend; waiting for direction.

新しいコメント