
Fifth Third Bancorp FITB reported first-quarter 2026 adjusted earnings per share (EPS) of 83 cents, which missed the Zacks Consensus Estimate of 84 cents. In the prior-year quarter, the company posted EPS of 73 cents.
Shares of the company lost nearly 1.3% in the early trading session following the release of worse-than-expected results. A full day’s trading session will provide a clearer picture.
Results were adversely impacted by a substantial rise in non-interest expenses and higher provisions for credit losses. However, growth in net interest income (NII) and fee income provided some support. Also, higher loan and deposit balances acted as tailwinds.
Results excluded a negative 68-cent impact of certain items. After considering this, the company reported net income available to common shareholders (GAAP basis) of $128 million, down 73% year over year.
FITB’s Quarterly Revenues & Expenses Rise
Total quarterly revenues (FTE) in the reported quarter were $2.83 billion, which increased 33% year over year. However, the top line missed the Zacks Consensus Estimate of $2.86 billion.
Fifth Third’s NII (on an FTE basis) for the first quarter was $1.94 billion, up 34% year over year. This improvement was driven by contributions from the Comerica acquisition, lower funding costs and disciplined balance sheet management.
The net interest margin (NIM) (on an FTE basis) increased to 3.30% from 3.03% in the year-ago quarter.
Non-interest income rose 29% year over year to $895 million. This rise was primarily due to an increase in wealth and asset management revenues, commercial payments revenues, consumer banking revenues, capital markets fees and commercial banking revenue.
Non-interest expenses surged 84% year over year to $2.39 billion. The increase was primarily due to a rise in all cost components.
The efficiency ratio was 84.5%, higher than the year-ago quarter’s 61%. An increase in the ratio indicates a deterioration in profitability.
FITB’s Loans & Deposits Increase Sequentially
As of March 31, 2026, portfolio loans and leases rose 44% to $176 billion from the previous quarter. Total deposits inched up 36% from the prior quarter to $234 billion.
FITB’s Credit Quality Deteriorates
The company reported a provision for credit losses of $227 million, up 30% from the year-ago quarter.
Total non-performing portfolio loans and leases were $999 million, which rose marginally on a year-over-year basis.
Net charge-offs in the first quarter increased to $144 million or 0.37% of average loans and leases (on an annualized basis) from $136 million or 0.46% in the prior-year quarter.
The total allowance for credit losses rose 25% to $3.15 billion year over year.
Fifth Third’s Capital Position Mixed
The CET1 capital ratio was 9.96% compared with 10.43% in the year-ago quarter. The Tier 1 risk-based capital ratio was 10.86% compared with 11.71% in the prior-year quarter.
The leverage ratio increased to 10.20% from 9.23% in the year-ago quarter.
Our Viewpoint on Fifth Third
Strong growth in NII, driven by the lower funding cost and balance sheet optimization, supported top-line expansion. The company also witnessed solid growth in loans and deposits, reflecting improving business momentum. This was further supported by contributions from the Comerica acquisition.
In February 2026, Fifth Third completed the acquisition of Comerica, creating the ninth-largest U.S. bank and significantly enhancing its scale, geographic reach and middle-market banking capabilities. The transaction is expected to generate significant cost synergies of around $850 million annually and boost earnings per share by approximately 9% by 2027, while strengthening its presence in high-growth markets. However, elevated expenses, including integration-related costs, remain near-term headwinds.
Fifth Third Bancorp Price, Consensus and EPS Surprise
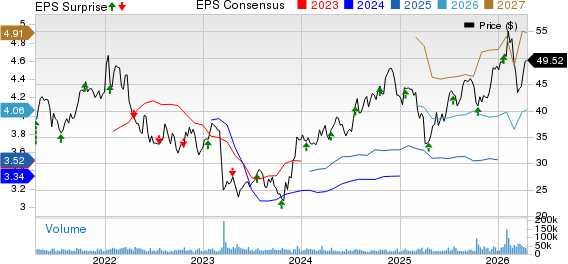
Fifth Third Bancorp price-consensus-eps-surprise-chart | Fifth Third Bancorp Quote
Currently, Fifth Third carries a Zacks Rank #2 (Buy). You can see the complete list of today’s Zacks #1 Rank (Strong Buy) stocks here.
Performance of Other Banks
M&T Bank Corporation MTB reported first-quarter 2026 net operating earnings per share of $4.18, which beat the Zacks Consensus Estimate of $4.02. The bottom line compared favorably with earnings of $3.38 per share in the year-ago quarter.
MTB’s results were aided by higher NII and a rise in non-interest income on a year-over-year basis, along with modest loan growth. However, a decline in deposits, higher provisions for credit losses, and elevated expenses acted as headwinds.
The PNC Financial Services Group, Inc. PNC has delivered adjusted earnings per share of $4.32 in the first quarter of 2026, beating the Zacks Consensus Estimate of $4.12 and up from $3.51 a year ago.
Results reflected higher NII, a rise in the net interest margin, and strong loan and deposit growth, aided by the FirstBank acquisition (completed in January 2026). However, higher expenses were headwinds for PNC.
#1 Semiconductor Stock to Buy (Not NVDA)
The incredible demand for data is fueling the market's next digital gold rush. As data centers continue to be built and constantly upgraded, the companies that provide the hardware for these behemoths will become the NVIDIAs of tomorrow.
One under-the-radar chipmaker is uniquely positioned to take advantage of the next growth stage of this market. It specializes in semiconductor products that titans like NVIDIA don't build. It's just beginning to enter the spotlight, which is exactly where you want to be.
See This Stock Now for Free >>Want the latest recommendations from Zacks Investment Research? Today, you can download 7 Best Stocks for the Next 30 Days. Click to get this free report
Fifth Third Bancorp (FITB): Free Stock Analysis Report
The PNC Financial Services Group, Inc (PNC): Free Stock Analysis Report
M&T Bank Corporation (MTB): Free Stock Analysis Report
This article originally published on Zacks Investment Research (zacks.com).