
Fortinet, Inc. (FTNT), headquartered in Sunnyvale, California, provides cybersecurity and convergence of networking and security solutions. Valued at $106 billion by market cap, the company offers network security appliances, software, and subscription services. Fortinet systems integrate the industry's broadest suite of security technologies, including firewall, VPN, antivirus, intrusion prevention (IPS), web filtering, antispam, and traffic shaping.
Companies worth $10 billion or more are generally described as “large-cap stocks,” and FTNT perfectly fits that description, with its market cap exceeding this mark, underscoring its size, influence, and dominance within the software - infrastructure industry. Fortinet's competitive strengths include its unified Security Fabric Platform, broad portfolio of security solutions, strong performance and reliability, AI-driven security operations, global reach and support, competitive pricing, and strong R&D investments. Its partner ecosystem and partnerships with major cloud providers further enhance its position.
More Top Stocks Daily: Go behind Wall Street’s hottest headlines with Barchart’s Active Investor newsletter.
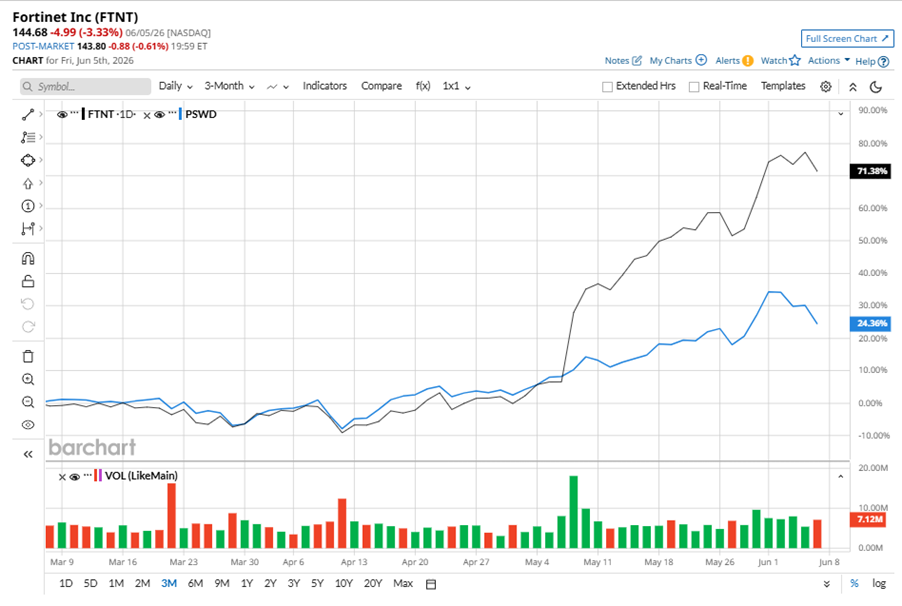
Despite its notable strength, FTNT slipped 3.6% from its 52-week high of $150.07, achieved on Jun. 4. Over the past three months, FTNT stock has gained 71.4%, outperforming the Xtrackers Cybersecurity Select Equity ETF’s (PSWD) 24.4% gains during the same time frame.
 www.barchart.com
Shares of FTNT rose 82.2% on a YTD basis and climbed 39.8% over the past 52 weeks, notably outperforming PSWD’s YTD gains of 17.3% and 8.5% returns over the last year.
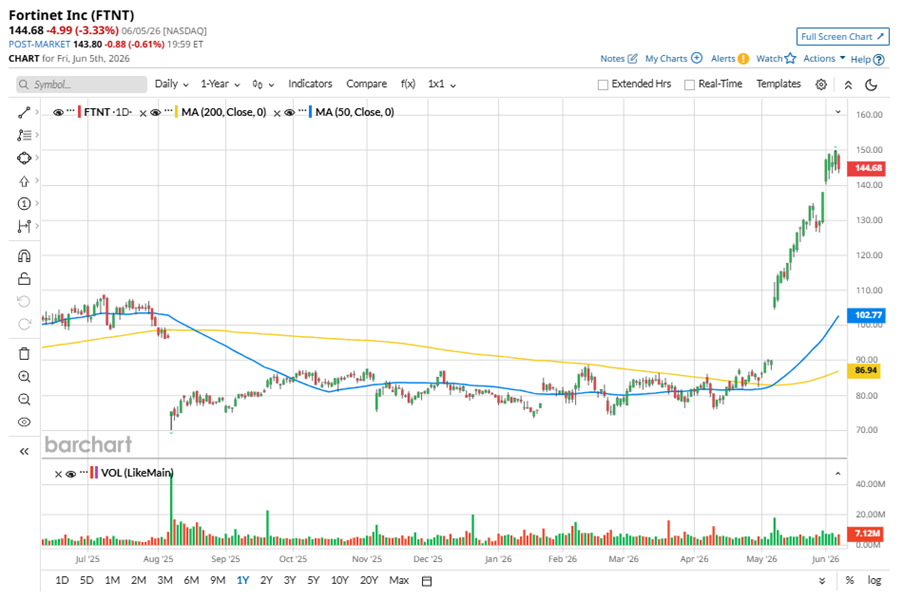
To confirm the bullish trend, FTNT has been trading above its 50-day moving average since late January, with some fluctuations. The stock is trading above its 200-day moving average since late April, with slight fluctuations.
 www.barchart.com
Fortinet’s outperformance was fueled by the FortiOS 8.0 launch, bringing AI-driven security, next-gen SASE, and quantum-safe protection. Automation via FortiAI is cutting response times, while demand is rising for sovereign SASE amid AI and geopolitical risks. Bundled SD-WAN and SASE offerings are driving upsells, and expanded inventory is supporting the positive outlook.
On May 6, FTNT reported its Q1 results, and its shares skyrocketed 20% in the following trading session. Its adjusted EPS of $0.82 topped Wall Street expectations of $0.61. The company’s revenue was $1.9 billion, topping Wall Street forecasts of $1.7 billion. Fortinet expects full-year adjusted EPS in the range of $3.10 to $3.16, and revenue ranging from $7.7 billion to $7.9 billion.
In the competitive arena of software - infrastructure, Palo Alto Networks, Inc. (PANW) has lagged behind FTNT, showing resilience with a 47.7% uptick on a YTD basis and 38% gains over the past 52 weeks.
Wall Street analysts are cautious on FTNT’s prospects. The stock has a consensus “Hold” rating from the 43 analysts covering it. While FTNT currently trades above its mean price target of $108.11, the Street-high price target of $150 suggests a 3.7% upside potential.
On the date of publication, Neha Panjwani did not have (either directly or indirectly) positions in any of the securities mentioned in this article. All information and data in this article is solely for informational purposes. For more information please view the Barchart Disclosure Policy here.
More news from Barchart
Ahead of Oracle Earnings, Here's What Barchart Data Says Comes Next for ORCL Stock Palo Alto Networks Delivers Strong FCF Margins - Is PANW Worth $350? After Recent Rally Sparked by Jensen Huang’s Comments, Marvell Stock Is a Buy Using SPY Put Options For Portfolio Protection