


As of September 13, the current XRP price is hovering around $1.34-$1.37 based on the technical data provided. The latest decline has brought the token close to a cluster of short- and intermediate-term support levels, leaving traders focused on whether buyers can stabilize the market or whether the correction will extend.
XRP Price Today Faces Pressure Below $1.40
The latest XRP price decline follows a rejection from the $1.43-$1.45 region and a subsequent break below the rising trendline of a tightening symmetrical triangle. TradingView analyst XAUApex described the move as a shift in short-term market structure, pointing to lower highs and lower lows as evidence of increasing selling pressure.
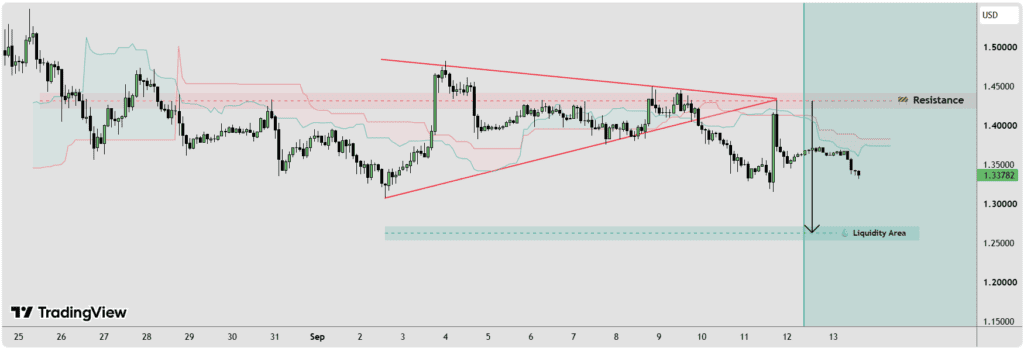
XRPUSD has broken below a tightening symmetrical triangle, weakening its short-term bullish structure and signaling a potential shift toward bearish momentum. Source: XAUApex on TradingView
The breakdown does not automatically confirm a prolonged bearish trend. A recovery above the broken trendline and the $1.43-$1.45 resistance area could weaken the bearish setup. Until that happens, however, the technical structure remains vulnerable to additional selling.
The development is consistent with the broader pullback seen since the price reached approximately $1.70. Recent market coverage also shows that XRP has struggled to regain the $1.40 level after falling from its multi-month high.
$1.31 Becomes the First XRP Support to Watch
The $1.31 area now stands out as an immediate downside reference. TradingView's Camarilla calculations place S1 at $1.3143, while XRP's 30-period exponential and simple moving averages sit around $1.327 and $1.338, respectively.
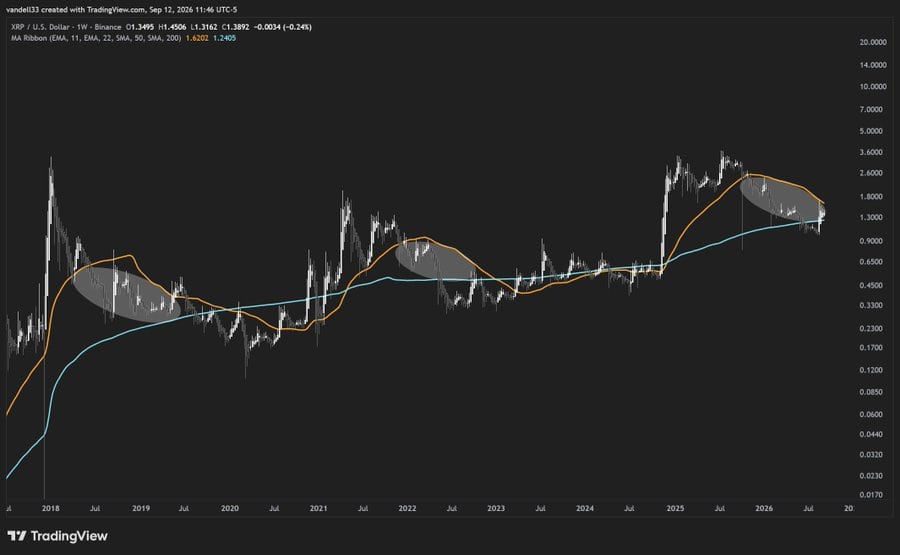
The XRP weekly chart shows price compressed between the 50-week and 200-week moving averages, with previous squeezes historically resolving through downside breaks. Source: @vandell33 via X
That places $1.31-$1.34 in a relatively dense technical area. XRP is currently trading close to the lower edge of this range, meaning a sustained move beneath it could weaken the short-term recovery structure.
The broader technical picture is not uniformly bearish. The 50-period EMA sits near $1.278, while the 100-period EMA is around $1.250. The corresponding simple moving averages are also below the current XRP price, suggesting that several intermediate-term indicators continue to provide a degree of support.
XRP Price Prediction: Why $1.17 Matters
A deeper correction would bring the $1.17 area into focus. The level is close to the 100-period SMA at $1.168 and also sits near the downside zone identified in a separate TradingView setup by Setupsfx.
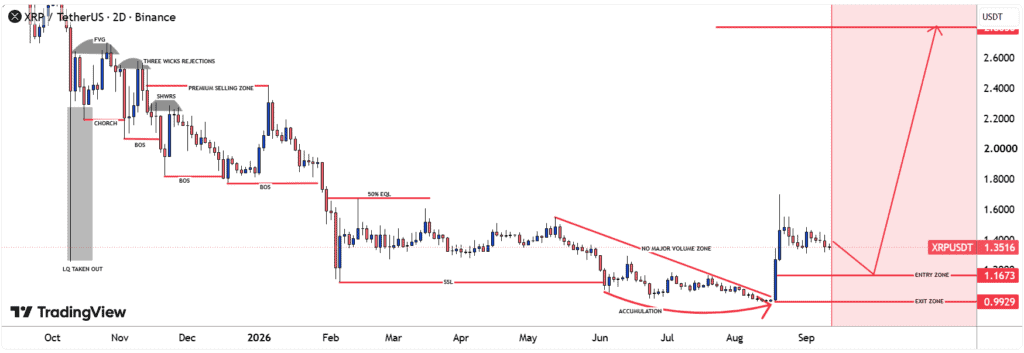
If $1.16 holds, XRP could face resistance at $1.50-$1.70 before potentially targeting $2.8030, although further confirmation would be required. Source: Setupsfx_ on TradingView
That analysis uses $1.1673 as a potential recovery area. However, the analyst does not consider a simple touch of the level sufficient confirmation. Instead, the setup calls for a bullish rejection, followed by a two-day close above the level and the formation of a higher low.
This makes $1.17 more than a simple numerical target in the current XRP price prediction. A reaction there could help determine whether the correction is developing into a broader base or whether sellers retain control.
The same analysis identifies $0.9929 as its invalidation level. A move below that zone would undermine the proposed recovery structure.
Whale Selling Adds to XRP's Downside Pressure
The technical breakdown comes alongside weaker on-chain activity.
According to data cited by analyst Ali Martinez, XRP has declined roughly 20% from $1.70 to around $1.35 over three weeks. The analysis also points to whale redistribution of approximately 90 million token during the latest week.
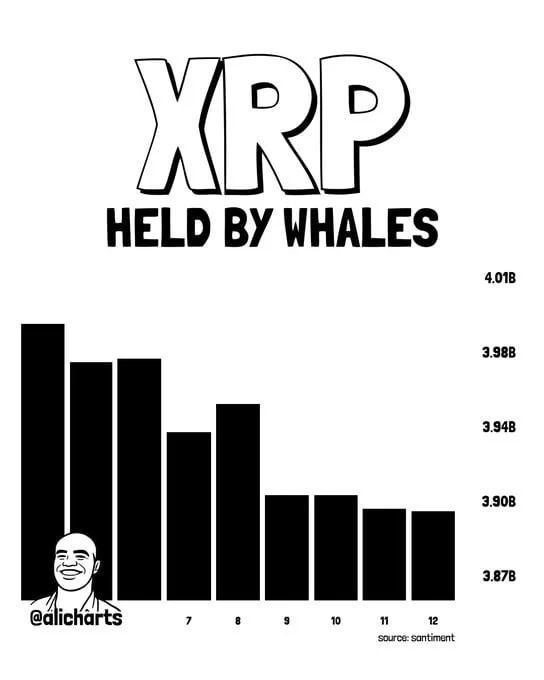
XRP has declined 20% over three weeks from $1.70 to $1.35, with profit-taking potentially contributing as whales sold or redistributed about 90 million XRP over the past week. Source: Ali Martinez via X
Separate reporting based on the same on-chain data indicates that daily active addresses fell by more than 90%, from roughly 388,000 to about 38,000.
The combination of lower network participation and whale selling provides additional context for the recent XRP price news . Reduced activity does not by itself determine the next direction, but it indicates that the strong participation seen during the August rally has faded considerably.
The $1.35 region remains particularly important. According to the cited analysis, approximately 2.29 billion token previously changed hands around that level, creating a sizeable historical transaction cluster. A sustained hold could therefore give buyers a reference point from which to attempt a recovery.
XRP Technical Indicators Remain Mixed
The latest TradingView technical summary presents a less decisive picture than the bearish triangle breakdown alone might suggest.
XRP's 14-period RSI is around 53.6, keeping the indicator in neutral territory. The Stochastic, CCI, ADX, Awesome Oscillator, and Ultimate Oscillator are also classified as neutral. Momentum and MACD, however, both carry sell signals.
Moving averages provide a more balanced reading. The 10-period EMA and SMA are above the current price and indicate short-term pressure. At the same time, the 30-, 50-, and 100-period averages remain below XRP and generate buy readings.
Overall, the TradingView snapshot shows 6 sell, 9 neutral, and 11 buy signals across the combined indicators. That balance suggests the the price chart has not reached a point where technical evidence establishes a clear long-term bearish trend.
$1.38 Reclaim Could Change the XRP Price Outlook
For buyers, reclaiming $1.38 would be an important first step. The cited on-chain analysis identifies that level as a threshold that could strengthen the case for a recovery toward $1.60-$1.68.
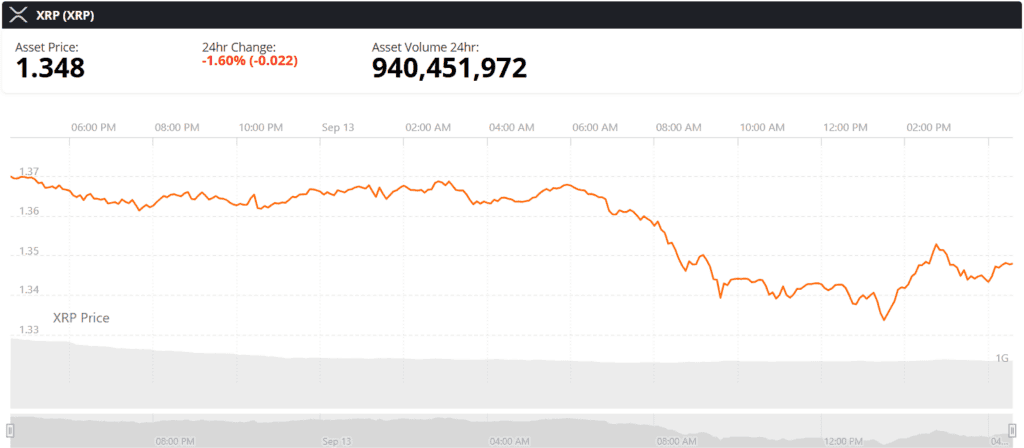
XRP price chart. Source: Brave New Coin
The next technical obstacle sits higher. The Camarilla framework places resistance at approximately $1.445, $1.510, and $1.575, while the Fibonacci pivot system places R1 near $1.626.
These levels broadly overlap with the $1.50-$1.70 resistance region highlighted in the TradingView recovery scenario. A sustained move through that range would represent a significant change from the current structure.
Recent market analysis has likewise identified $1.55 as a key resistance level, with a confirmed break potentially putting $1.68 back into focus.
XRP Price Forecast: $1.31 or $1.17 Could Define the Correction
The immediate X RP price forecast is therefore centered on support rather than an aggressive upside target.
Holding the $1.31 area would give the price an opportunity to stabilize after the triangle breakdown. A recovery through $1.38 could then challenge the $1.43-$1.45 resistance zone and potentially reopen the path toward $1.50-$1.68.
A sustained break below $1.31, however, would put the $1.25 area and eventually $1.17 into greater focus. The latter level is particularly relevant because it aligns with a longer-term moving average and the separate TradingView recovery setup.
For now, the XRP price today reflects a market caught between weakening short-term momentum and still-supportive intermediate-term averages. The bearish triangle breakdown has increased downside risk, but confirmation of a deeper trend reversal would require further price deterioration. Conversely, reclaiming the broken structure and moving back above $1.43-$1.45 would weaken the current bearish interpretation.
As a result, $1.31 and $1.17 are best viewed as technical reference zones rather than predetermined XRP price targets . Price behavior around those levels should provide a clearer indication of whether the current pullback is developing into a deeper correction or a potential base for recovery.