


Valley National Bancorp's VLY second-quarter 2026 adjusted earnings per share of 30 cents missed the Zacks Consensus Estimate by a penny. However, the bottom line compared favorably with earnings of 23 cents in the year-ago quarter.
Results were hampered by higher non-interest expenses. Higher net interest income (NII), increased non-interest income, lower provisions for credit losses, and growth in loan and deposit balances acted as tailwinds.
Results excluded certain non-core charges. Including those, net income available to common shareholders was $163.6 million, which jumped 29.6% from the year-ago quarter.
Valley National’s Revenues Improve, Expenses Rise
Total revenues (on an FTE basis) were $562.1 million, up 13.3% year over year. The top line beat the Zacks Consensus Estimate of $552.02 million.
NII (FTE basis) was $488.4 million, up 12.6% year over year. The net interest margin (FTE basis) was 3.2%, which expanded 19 basis points (bps).
Non-interest income jumped 17.7% to $73.7 million. The rise was driven by an increase in almost all fee income components, except fees from loan servicing, net gains on sale of loans, and bank-owned life insurance.
Non-interest expenses of $311.1 million increased 9.5% year over year. The rise was due to an increase in almost all cost components, except for FDIC insurance assessment costs and amortization of other intangible assets. Additionally, no loss on extinguishment of debt was reported this quarter.
The efficiency ratio was 52.11%, down from 55.20% in the prior-year quarter. A decline in the efficiency ratio indicates an improvement in profitability.
VLY’s Loans & Deposits Rise
As of June 30, 2026, total loans were $52.5 billion, up 6.2% year over year. This increase was driven by growth across all loan categories. Total deposits were $54.1 billion, up 6.7% year over year.
Valley National’s Credit Quality: A Mixed Bag
As of June 30, 2026, total non-performing assets were $467.8 million, up 6.4% year over year, primarily due to higher non-accrual loans, partially offset by other real estate owned (OREO), and other repossessed assets.
However, allowance for credit losses as a percentage of total loans was 1.16%, down 4 bps year over year. In the second quarter of 2026, VLY reported total provision for credit losses of $29.2 million, a 22.8% year-over-year decline.
VLY’s Profitability Improves, Capital Ratios Mixed
At the end of the second quarter, adjusted annualized return on average assets was 1.05%, up from 0.87% in the year-earlier quarter. Adjusted annualized return on average shareholders’ equity was 8.75%, up from 7.15%.
As of June 30, 2026, the tangible common equity to tangible assets ratio was 8.71%, up from 8.63% in the corresponding period of 2025. Tier 1 risk-based capital ratio was 11.37%, down from 11.57%. Also, the common equity tier 1 capital ratio of 10.71% was down from 10.85% as of June 30, 2025.
Valley National’s Share Repurchase Update
In the reported quarter, VLY repurchased 1.5 million shares at an average price of $13.4 under its ongoing stock buyback program.
Our Take on VLY
Robust loan growth, stabilizing funding costs, and efforts to enhance fee income are expected to keep supporting Valley National’s top-line growth. However, elevated expenses and significant exposure to commercial real estate loans remain near-term headwinds.
Valley National Bancorp Price, Consensus and EPS Surprise
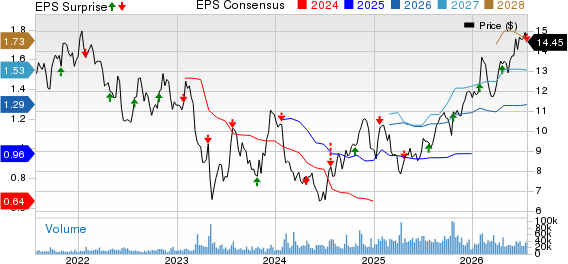
Valley National Bancorp price-consensus-eps-surprise-chart | Valley National Bancorp Quote
Valley National currently carries a Zacks Rank #3 (Hold). You can see the complete list of today’s Zacks #1 Rank (Strong Buy) stocks here.
Performance of VLY’s Peers
Hancock Whitney Corp.’s HWC second-quarter 2026 earnings per share of $1.55 matched the Zacks Consensus Estimate. The bottom line rose 17.4% from the year-ago quarter.
HWC’s results were primarily aided by higher NII and non-interest income along with a decline in provisions. Also, a sequential increase in loans and deposit balances was positive. However, higher expenses were the undermining factor.
BankUnited, Inc.’sBKU second-quarter 2026 earnings of 97 cents per share missed the Zacks Consensus Estimate of $1.02. However, the bottom line rose 6.6% from the prior-year quarter.
Results were primarily hurt by a rise in non-interest expenses. Also, sequential declines in loans and deposits were negatives. However, higher NII and fee income, along with lower provisions, provided some support to BKU’s performance.
7 Best Stocks for the Next 30 Days
Just released: Experts distill 7 elite stocks from the current list of 220 Zacks Rank #1 Strong Buys. They deem these tickers "Most Likely for Early Price Pops."
Since 1988, the full list has beaten the market more than 2X over with an average gain of +23.9% per year. So be sure to give these hand picked 7 your immediate attention.
See them now >>Want the latest recommendations from Zacks Investment Research? Today, you can download 7 Best Stocks for the Next 30 Days. Click to get this free report
Valley National Bancorp (VLY): Free Stock Analysis Report
BankUnited, Inc. (BKU): Free Stock Analysis Report
Hancock Whitney Corporation (HWC): Free Stock Analysis Report
This article originally published on Zacks Investment Research (zacks.com).