

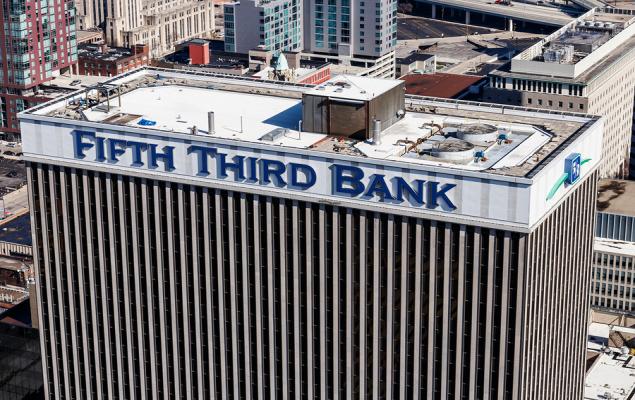
Fifth Third Bancorp FITB reported third-quarter 2026 adjusted earnings per share (EPS) of $1.13, which surpassed the Zacks Consensus Estimate of $1.09. In the prior-year quarter, the company posted adjusted EPS of 93 cents.
Results benefited from solid growth in net interest income (NII) and fee income, along with higher loan and deposit balances. Lower provisions for credit losses also offered support. However, a substantial year-over-year rise in non-interest expenses acted as a headwind.
Results excluded a negative 23-cent impact of certain items, including merger-related charges, interchange litigation matters and technology-related asset impairments. After considering these, the company reported net income available to common shareholders (GAAP basis) of $828 million, up 36% year over year.
FITB’s Quarterly Revenues & Expenses Rise
Total quarterly revenues (FTE) in the reported quarter were $3.28 billion, which increased 42% year over year. The top line missed the Zacks Consensus Estimate of $3.34 billion.
Fifth Third's NII (on an FTE basis) for the third quarter was $2.28 billion, up 49% year over year. This improvement primarily reflected the addition of Comerica. Continued fixed-rate asset repricing and balance sheet management also aided growth.
The net interest margin (NIM) (on an FTE basis) increased to 3.34% from 3.13% in the year-ago quarter.
Non-interest income rose 29% year over year to $1.01 billion. The increase was primarily driven by higher wealth and asset management revenues, commercial payments revenues, consumer banking revenues, capital markets fees and commercial banking revenues, partly offset by a decline in mortgage banking net revenues and other non-interest income.
Non-interest expenses surged 62% year over year to $2.05 billion. The increase was primarily due to a rise across all cost components, particularly compensation and benefits, technology and communications, and other non-interest expenses. Merger-related charges also contributed to elevated expenses.
The efficiency ratio was 62.4%, higher than the year-ago quarter's 54.9%. An increase in the ratio indicates a deterioration in profitability.
FITB’s Loans & Deposits Increase Sequentially
As of Sept. 30, 2026, portfolio loans and leases rose 1% to $180.3 billion from the previous quarter. Total deposits increased 2% sequentially to $239 billion.
FITB’s Credit Quality: Mixed Bag
The company reported a provision for credit losses of $122 million, down 38% from the year-ago quarter.
Total non-performing portfolio loans and leases were $1.07 billion, up from $768 million in the prior-year quarter. However, the non-performing loan ratio improved to 0.59% from 0.62% in the year-ago quarter.
Net charge-offs in the third quarter declined to $139 million or 0.31% of average loans and leases (on an annualized basis) from $339 million or 1.09% in the prior-year quarter.
The total allowance for credit losses rose 30% year over year to $3.13 billion. The allowance for credit losses represented 1.74% of portfolio loans and leases, down from 1.96% in the year-ago quarter.
Fifth Third’s Capital Position Weakens
The CET1 capital ratio was 10.02% compared with 10.57% in the year-ago quarter. The Tier 1 risk-based capital ratio was 10.90% compared with 11.63% in the prior-year quarter.
The leverage ratio declined marginally to 9.22% from 9.24% in the year-ago quarter.
FITB's Segment-Wise Performance
Commercial Banking reported NII (FTE) of $1.15 billion compared with $594 million in the year-ago quarter. Non-interest income increased to $512 million from $357 million, while non-interest expenses rose to $761 million from $454 million.
Consumer and Small Business Banking reported NII (FTE) of $1.27 billion compared with $1.08 billion in the prior-year quarter. Non-interest income increased to $326 million from $309 million, while non-interest expenses rose to $855 million from $653 million.
Wealth and Asset Management reported NII (FTE) of $112 million compared with $55 million in the year-ago quarter. Non-interest income increased to $183 million from $109 million, while non-interest expenses rose to $182 million from $93 million.
Fifth Third's Q4 Guidance
For the fourth quarter of 2026, Fifth Third expects average loans and leases to rise 1-2% sequentially.
NII is projected to increase 2.5-3.5% from the third-quarter baseline of $2.28 billion, while non-interest income is expected to rise 2-4% from the baseline of $1.05 billion.
Adjusted non-interest expenses are expected to decline 2-3% sequentially from the third-quarter baseline of $1.82 billion. The net charge-off ratio is projected to be between 30 and 35 basis points, while the effective tax rate is expected to be 22.5%.
Our Viewpoint on Fifth Third
Strong growth in NII, driven by the addition of Comerica, continued fixed-rate asset repricing and disciplined balance sheet management, supported top-line expansion. The company also witnessed solid growth in loans and deposits, reflecting improving business momentum.
Broad-based fee income growth and lower provisions were other positives. The decline in the net charge-off ratio also reflected improved credit performance. However, elevated year-over-year expenses, higher deposit costs and lower year-over-year capital ratios remain near-term concerns.
On the acquisition front, Fifth Third successfully completed the Comerica systems conversion during the third quarter, with strong client and banker retention. The company also secured the full $850 million annualized expense run rate, which is expected to be realized in the fourth quarter of 2026.
Fifth Third Bancorp Price, Consensus and EPS Surprise
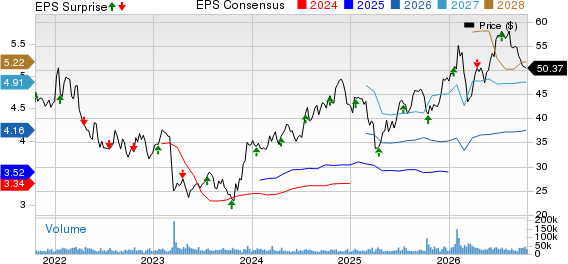
Fifth Third Bancorp price-consensus-eps-surprise-chart | Fifth Third Bancorp Quote
Currently, Fifth Third carries a Zacks Rank #3 (Hold). You can see the complete list of today’s Zacks #1 Rank (Strong Buy) stocks here.
Performance of Other Banks
M&T Bank Corporation MTB reported third-quarter 2026 net operating earnings per share of $5.08, which beat the Zacks Consensus Estimate of $4.98. The bottom line compared favorably with earnings of $4.87 in the year-ago quarter.
MTB’s results were aided by higher NII and loan growth. However, lower non-interest income and higher expenses, along with a sequential decline in deposits, acted as headwinds.
The PNC Financial Services Group, Inc. PNC has delivered adjusted earnings per share of $5.09 in the third quarter of 2026, beating the Zacks Consensus Estimate of $4.97. The bottom line increased 17% from $4.35 in the year-ago quarter.
PNC’s results reflected higher NII, solid loan and deposit growth and improved operating efficiency. However, higher expenses and increased net loan charge-offs were headwinds.
Zacks' Research Chief Names "Stock Most Likely to Double"
Our team of experts has just released the 5 stocks with the greatest probability of gaining +100% or more in the coming months. Of those 5, Director of Research Sheraz Mian highlights the one stock set to climb highest.
This innovative software-as-a-service firm upped its user base +22% year over year. That rate is increasing and margins are expanding as AI efficiencies take effect. Of course, all our elite picks aren't winners, but this one could far surpass earlier Zacks' Stocks Set to Double like D-Wave Quantum, which shot up +680.1%.
Free: See Our Top Stock And 4 Runners UpWant the latest recommendations from Zacks Investment Research? Today, you can download 7 Best Stocks for the Next 30 Days. Click to get this free report
Fifth Third Bancorp (FITB): Free Stock Analysis Report
The PNC Financial Services Group, Inc (PNC): Free Stock Analysis Report
M&T Bank Corporation (MTB): Free Stock Analysis Report
This article originally published on Zacks Investment Research (zacks.com).