MetaTrader 5用テクニカル指標

テクニカル指標からのシグナルは、株式市場やFX市場での取引のエントリーとエグジットにおいて重要な役割を果たします。指標の本質は、将来の価格変動を予測することを目的とした、金融商品の価格の数学的変換です。テクニカル指標を試して、市場の動きをより正確に予測し、利益を上げましょう。


インジケータの種類
価格
—

Visual Wolf Sphere Indicator

30 USD

Visual Eagle Momentum Indicator

66 USD

Visual Arctic Wolf Indicator

30 USD

Visual Tiger Speed Indicator

150 USD

Visual Polar Bear Indicator

105 USD

Squeeze Momentum Force MT5

33 USD

Visual Falcon Range Indicator

87 USD

Visual Eagle Momentum Cycle indicator

82 USD

Visual Lynx Wave Indicator

49 USD

Visual Wolf Momentum Indicator

30 USD

Visual Eagle Indicator

30 USD

Visual Dolphin Indicator

66 USD

Visual Wave Indicator

30 USD

Gann ToolsBox By Ameer

1 500 USD

FlowZone Pro

119 USD

Kill sessions

50 USD

Smart Arrows

30 USD

Entry Pointz Pro

30 USD

Visual Eagle ATR Ratio Indicator

74 USD

Visual Wolf Bands Indicator

30 USD

Visual Fox Channel indicator

91 USD

Visual Wolf Trend Line Indicator

30 USD

Visual Panda Tracker Indicator

95 USD

Visual Eagle Trend Indicator

79 USD

Visual Tiger Momentum Indicator

150 USD

Visual Crocodile Pulse Indicator

30 USD

Visual Lion Strength Indicator

120 USD

Visual Arctic Fox Trends Indicator

75 USD

Visual Polar Bear RSI Indicator

57 USD

Visual Pangolin Trend Indicator

109 USD

Visual Wave Dolphin Indicator

30 USD

Visual Cheetah Run Indicator

30 USD

Visual Cheetah Wave Indicator

30 USD

ClassicMACD

35 USD

RASA Algo Premium Enhanced Trading Suite

50 USD

Visual Falcon Wave Indicator

76 USD

Visual Falcon Indicator

79 USD

Visual Panther Indicator

57 USD

Visual Cobra Momentum Wave Indicator

30 USD

Super Trend Scalper

99 USD

Volatility 75 Trend

99 USD

BIAS Detector

50 USD

Neuro Future

99 USD

ARIScalping

無料

WVAP Scalping

175 USD

Vice DayTranding Indicator

100 USD

Trade Filter

無料

Zero Lag Liquidity MT5 Scanner

35 USD

TendencyView

30 USD

Savage Indicator XAUUSD

無料

Bullhouse Marketprofile

49 USD

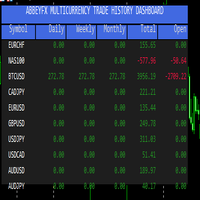
Abbeyfx Multicurrency Trade History Dashboard

40 USD

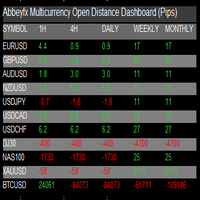
Abbeyfx Multicurrency Open Distance Dashboard MT5

50 USD

MA Percentile Bands

30 USD

Predator Structure Oscillator

49 USD

Support and Resistance Made Easy MT5

30 USD

Bullhouse Anchored VWAP

49 USD

Order Book Tilt with Volume Meter

50 USD

DailyVariationV1

30 USD

Basic Smart Breaker Block Zones SMC Indicator MT5

30 USD

Apex Swing VWAP MT5

36 USD

Risk Killer AI Navigator MT5

59 USD

DS Moving Average Gradient

30 USD

Yoda Trend Force

59 USD

Smart Smc Mmxm based Buy Sell Signals mt5

299 USD

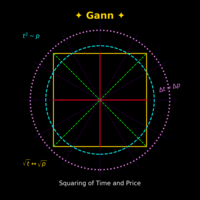
Gann Squaring Out of Time and Price

2 000 USD

Ict and Smc PriceAction toolkit

250 USD

Buy Sell Signals Arrows MT5

80 USD

Day Trading Indicator MT5

30 USD

Buy n Sell Indicator

1 999 USD

I know Buy or Sell

45.67 USD

Volatility Fusion Analyst

46 USD

テクニカル指標に関するよくある質問

テクニカル指標とは何ですか?

テクニカル指標は、価格、出来高、その他の市場データを処理し、その結果をチャート上または別ウィンドウに表示します。生の価格データだけでは把握しにくいトレンド、モメンタム、ボラティリティ、市場水準、パターンなどの特徴を評価するのに役立ちます。

インジケータは自動的に取引を開始できますか?

いいえ。インジケータは、分析情報を算出して表示するためのものです。インジケータ単独で取引注文を送信することはできません。一方、エキスパートアドバイザー(EA)はインジケータの値を読み取り、自動売買戦略の一部として利用できます。

インジケータはエキスパートアドバイザーとどう違うのですか?

インジケータは市場を分析し、その算出結果をチャート上に表示します。エキスパートアドバイザー(EA)は市場データを分析するだけでなく、取引操作も実行できます。簡単に言えば、インジケータは情報を提供し、EAはその情報を使って取引を実行できます。

「ストア」ではどのような種類のインジケータを利用できますか?

「ストア」には、トレンド系インジケータ、オシレーター、チャネル、レベル、パターン認識ツール、マルチタイムフレームおよびマルチカレンシー製品、クラスターインジケータ、出来高分析ツールなどがあります。単にシグナルの数だけでなく、分析したい市場の特徴に基づいてカテゴリを選択してください。

購入前にインジケータを試すことはできますか?

はい。デモ版をダウンロードし、MetaTrader 5のストラテジーテスターでビジュアルテストモードを実行してください。過去のデータ上でインジケータがどのように動作するか、値がどのように変化するか、シグナルがどこに表示されるかを確認できます。デモ版のインジケータは、通常のオンラインチャートでは起動できません。

1つのチャートでは複数のインジケータを使用できますか?

はい。MetaTrader 5では、1つのチャートに追加できるインジケータの数に固定された上限はありません。ただし、似たインジケータを多数使用すると、シグナルが重複したり、チャートの更新が遅くなったり、画面が見づらくなったりする可能性があります。分析上、異なる問いに答えるインジケータだけを追加してください。

役立つテクニカル指標は選ぶにはどうすればいいですか?

まず、その指標で何を把握したいのかを明確にしてください。トレンドの方向性、モメンタム、ボラティリティ、出来高、価格水準、エントリータイミングなどが考えられます。次に、算出方法、対応する銘柄と時間足、入力設定、シグナルの頻度を確認します。新しいデータの到着によって、すでに表示された値やシグナルが変化する可能性があるかどうかも確認することが重要です。

「ストア」からインジケータをチャートに追加するにはどうすればいいですか?

ナビゲータを開き 、インストールした製品を「インジケータ」で探します。通常は「マーケット」フォルダにあります。製品をダブルクリックするか、目的のチャートにドラッグ&ドロップします。 入力パラメータ、色、レベルを確認し、[OK]をクリックして算出を開始します。