
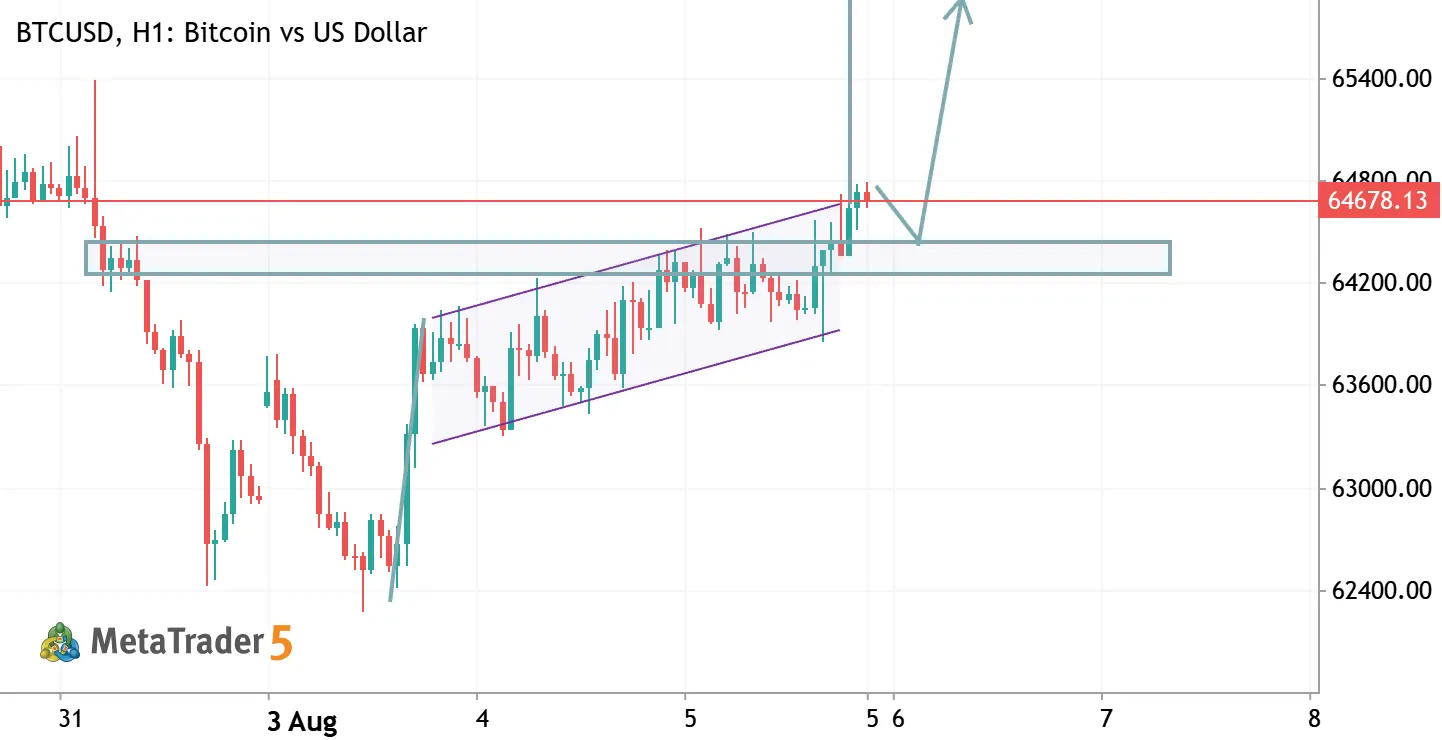
📊 Trade Setup: BTC/USD (H1 Timeframe)
- Entry Zone (Buy Limit / Retest): $64,300 – $64,500 (Waiting for a retest of the broken flag boundary / horizontal support zone)
- Stop Loss (SL): $63,800 (Placed safely below the ascending flag structure and local order block)
- Take Profit (TP): $66,000 – $66,200 ( targeting the major overhead liquidity pool and previous high supply zone)
- Risk/Reward Ratio: ~2.5:1
🔑 Key Analysis & Confluence Factors
- Market Structure Shift (MSS): Price swept liquidity around $62,000 and violently shifted to the upside, creating higher highs and breaking minor resistance levels.
- Bull Flag Pattern Breakout: The consolidation pattern (ascending channel/flag) between $63,300 and $64,400 has broken out upward, signaling bullish continuation.
- Key Retest Strategy: The arrow indicates a classic break-and-retest model. We wait for price to pull back to the demand block around $64,300–$64,500 before confirming continuation toward $66,000.
⚠️ Disclaimer: Not financial advice. Always manage your risk appropriately and use proper position sizing.
#Bitcoin #BTC #CryptoTrading #TechnicalAnalysis #BullishFlag #TradingSignals #CryptoAnalysis #PriceAction #SmartMoneyConcepts #BTCUSD #CryptoCommunity

 MQL5 프로필
새 코멘트