
Related tickers
| # | 이름 | 가격 | 24h % | 7d % | 1M % | 1Y % | 이전 7일 | |
|---|---|---|---|---|---|---|---|---|
| 1 | LTCUSD Litecoin vs US Dollar | 57.79 USD | -0.87% | +1.40% | -18.43% | -41.58% | ||
| 2 | ETHUSD Ethereum vs US Dollar | 2400.18 USD | +0.66% | +2.13% | -10.60% | -41.16% | ||
| 3 | MBTUSD milliBitcoin vs US Dollar | 81.279 USD | +0.07% | +0.54% | -3.73% | -28.44% | ||
| 4 | ETCUSD Ethereum Classic vs US Dollar | 7.785 USD | +1.86% | +4.34% | -17.92% | -52.77% |
뉴스
비트코인 변동폭 13%→6% 축소…8만~8만6000달러 압축 지속
트럼프, 이란 공격 오늘 있을 수도…비트코인 $8만 유지할까
BTC, 81,000달러 돌파…일간 1.51% 상승
고액 비트코인 보유자, 매도 대신 대출·수익 창출로 전환
BTC·ETH 3억9,700만 달러 롱 포지션 보유 고래, 921만 달러 증거금 추가…ETH 청산가 2,181달러로 하향
코인베이스, BTC·ETH·SOL 단기 가격 예측시장 출시…15분~일간 거래
비트코인 $8만 하락…$2억 레버리지 청산
지난 24시간 전 네트워크 선물 청산액 8억4600만 달러…롱 포지션 청산이 주도
BTC, 80,000달러 하회…일중 2.07% 하락
피델리티 "비트코인 20만달러, 예상보다 빨리 올 수도"
아서 헤이즈, 암호화폐 2200만 달러 매도…추가 하락 경고
차트 & 아이디어
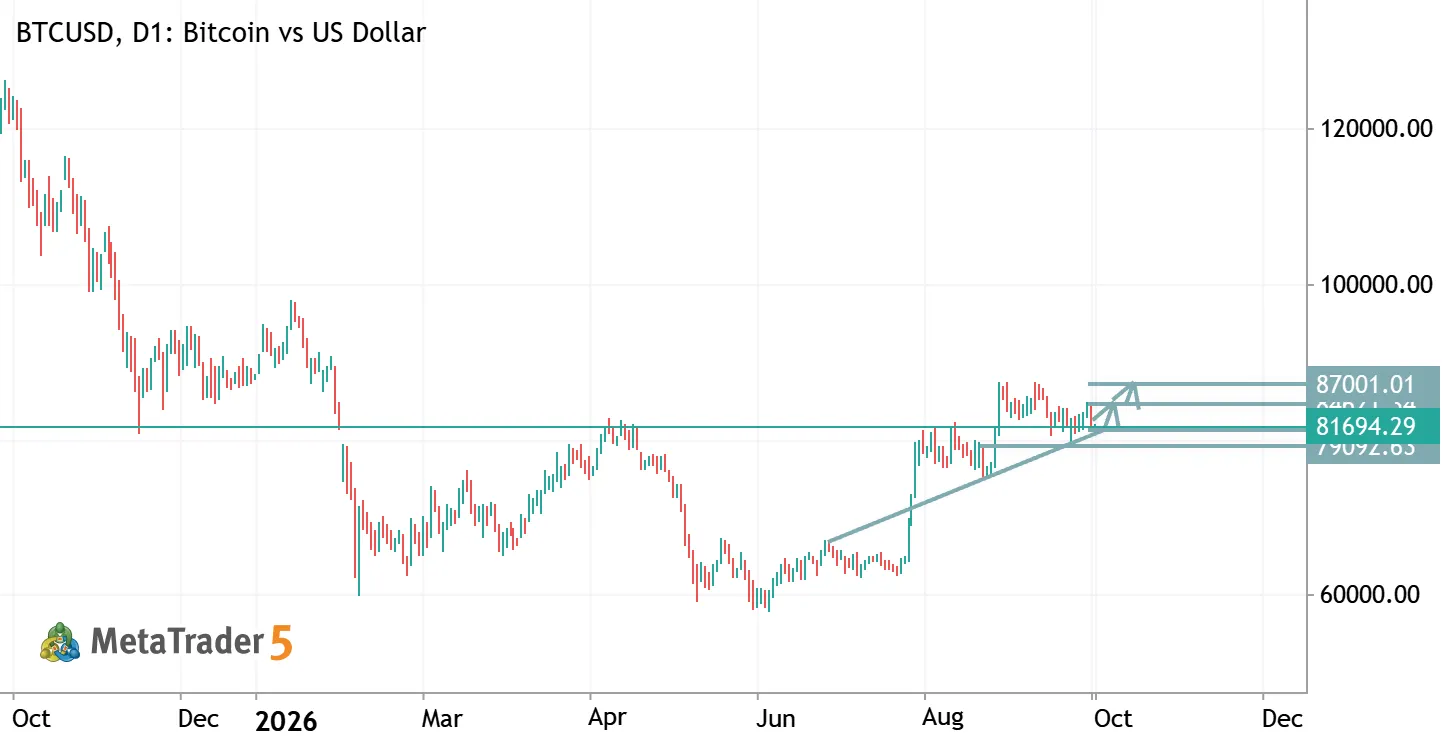
BTCUSD TRADE IDEA
BTCUSD – Trade Analysis (D1) Trend: Bullish recovery; price is consolidating above rising trendline support. Buy Entry: 81,700–82,000 (after bullish confirmation) TP1: 84,621 TP2: 87,001 Support: 79,092 Stop Loss: Below 79,000. Outlook: Bullish above 81,700. A breakout above 84,621 may push BTC toward 87,001. Risk management: Wait for confirmation and risk only a small portion of your capital

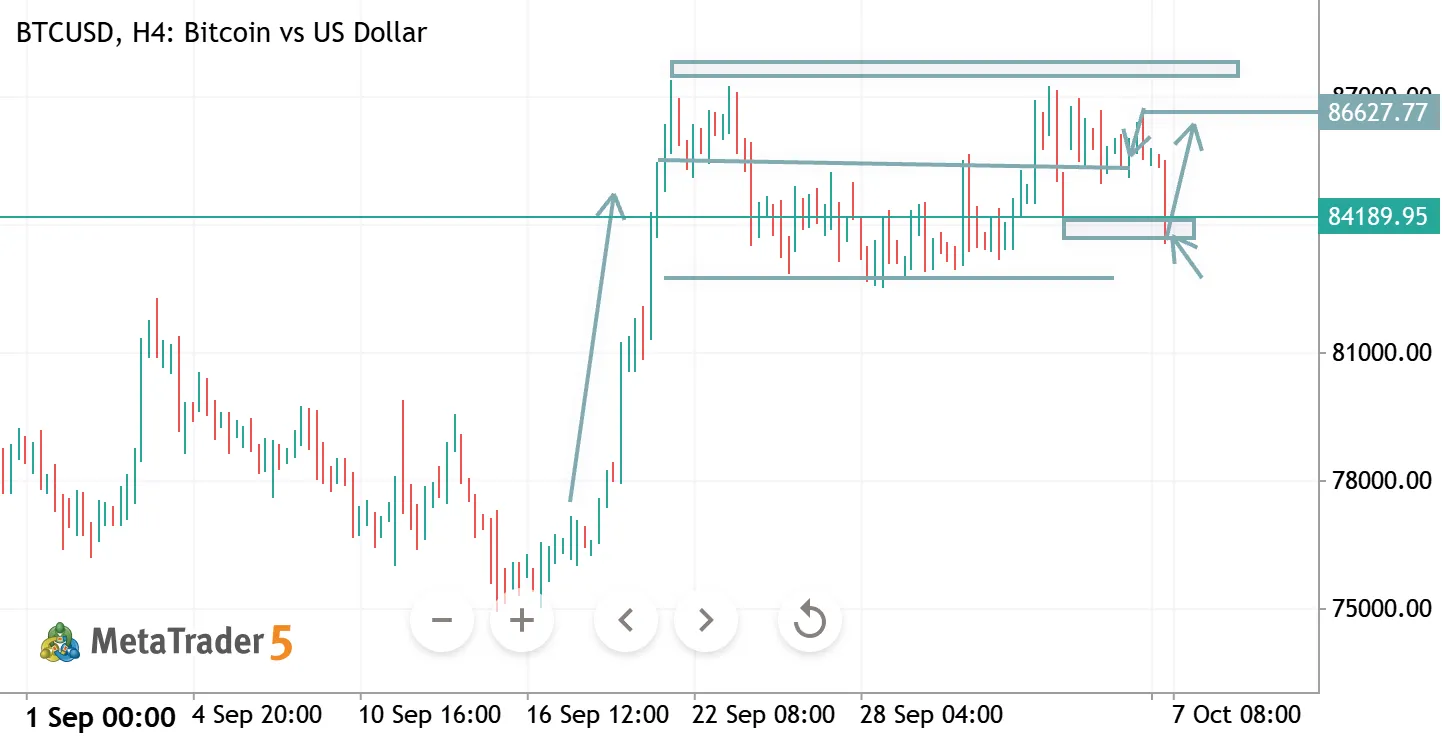
BTCUSD H4 ANALYSIS
BTCUSD H4 Analysis
BTC is consolidating near 84,100 after a strong recovery. The 84,000–84,500 zone is key support; holding above it could push price back toward 86,700–88,000.
🔹 Support: 84,000–84,500 🔹 Resistance: 86,700–88,000 🔹 Bias: Bullish above 84,000 🔹 Key Trigger: Break above 86,700 → upside continuation.

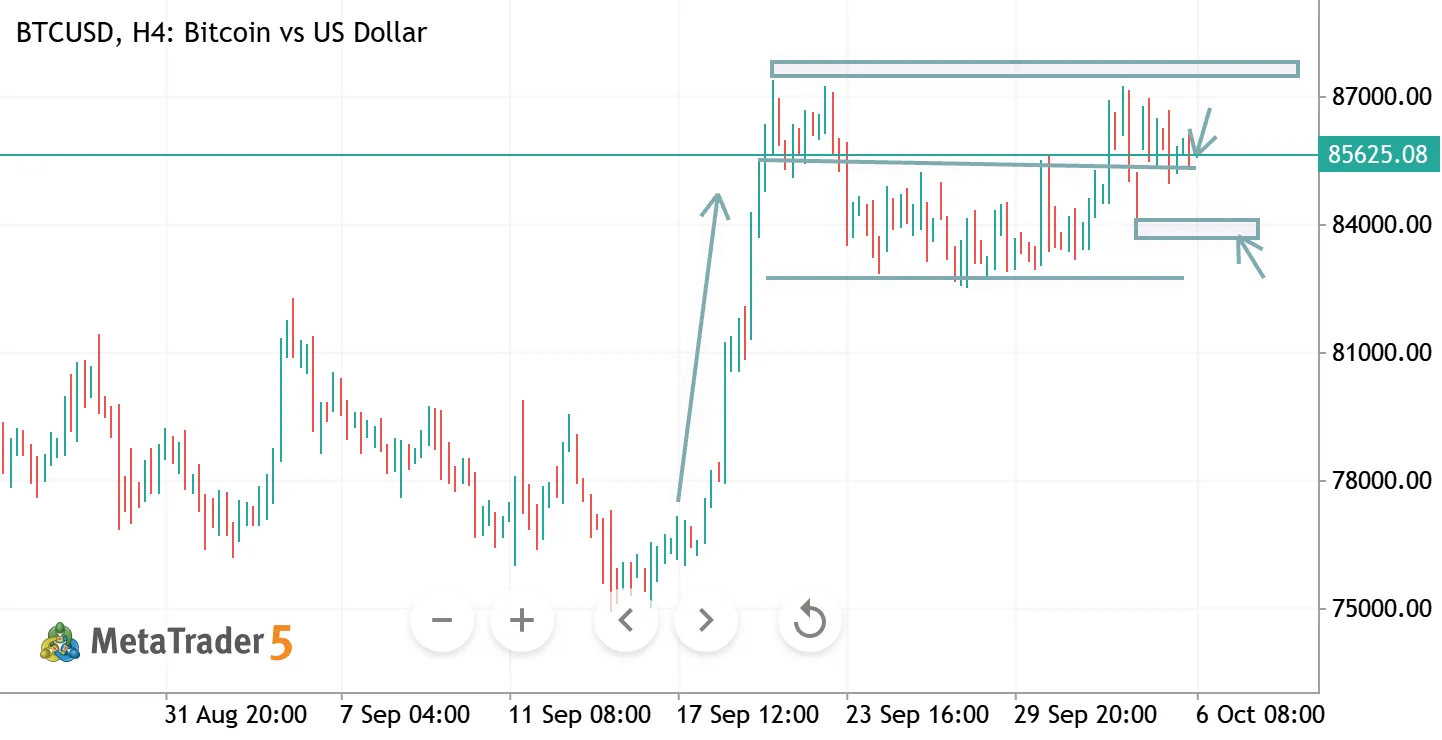
BTCUSD H4 ANALYSIS
BTCUSD H4 Analysis
BTC is consolidating below the 86,000–87,000 resistance zone after a strong recovery. A breakout above this area could resume the bullish move toward 88,000, while rejection may pull price back toward 84,000–82,500.
🔹 Resistance: 86,000–87,000 🔹 Support: 84,000–82,500 🔹 Bias: Bullish above 84,000 🔹 Key Trigger: H4 close above 87,000 → upside continuation.
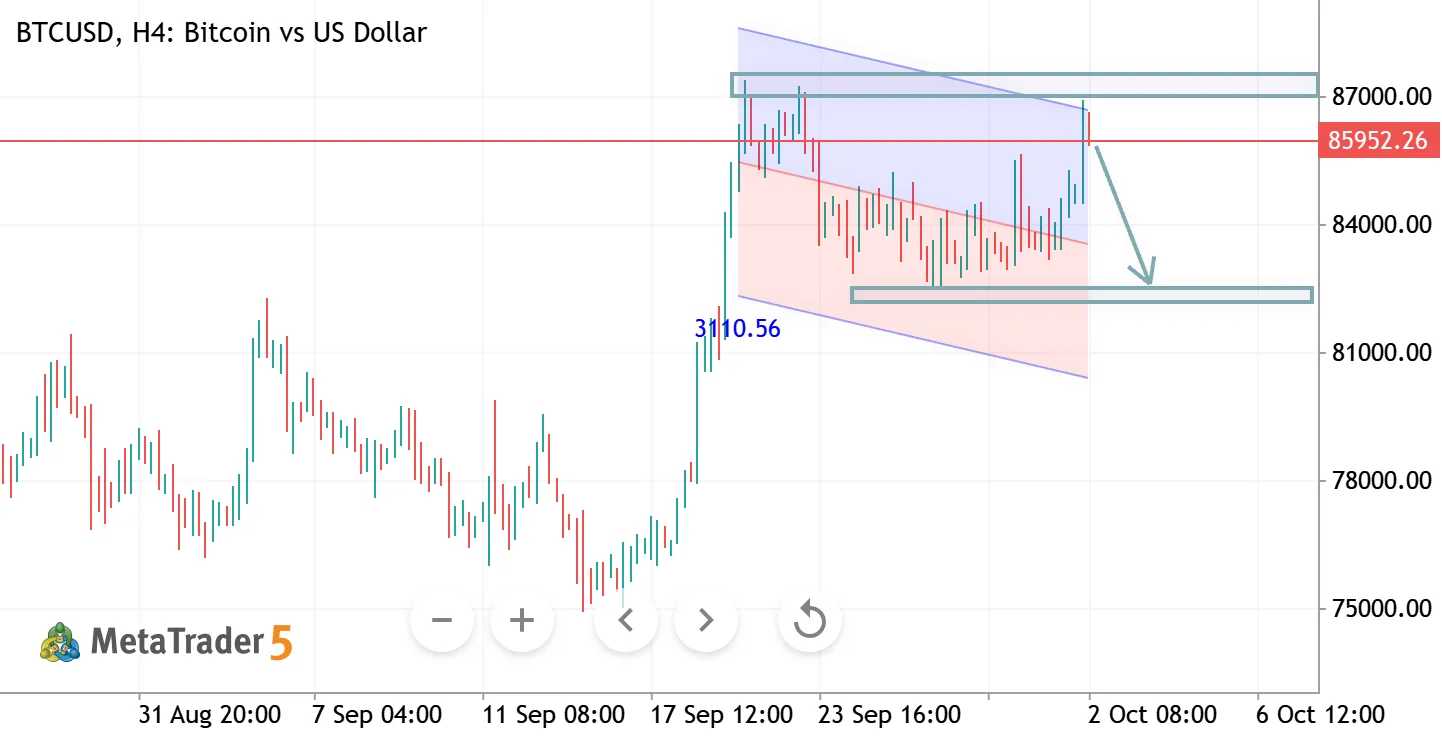
BTCUSD H4 ANALYSIS
BTCUSD H4 Analysis Bitcoin is testing a major resistance zone around 85,800–86,500 after a strong recovery. Rejection here could trigger a pullback toward the 82,000 support zone. 🔹 Resistance: 85,800–86,500 🔹 Support: 82,000–82,500 🔹 Bias: Bearish below 86,500 🔹 Key Trigger: Break above 86,500 → bullish continuation; rejection → downside toward 82,000.
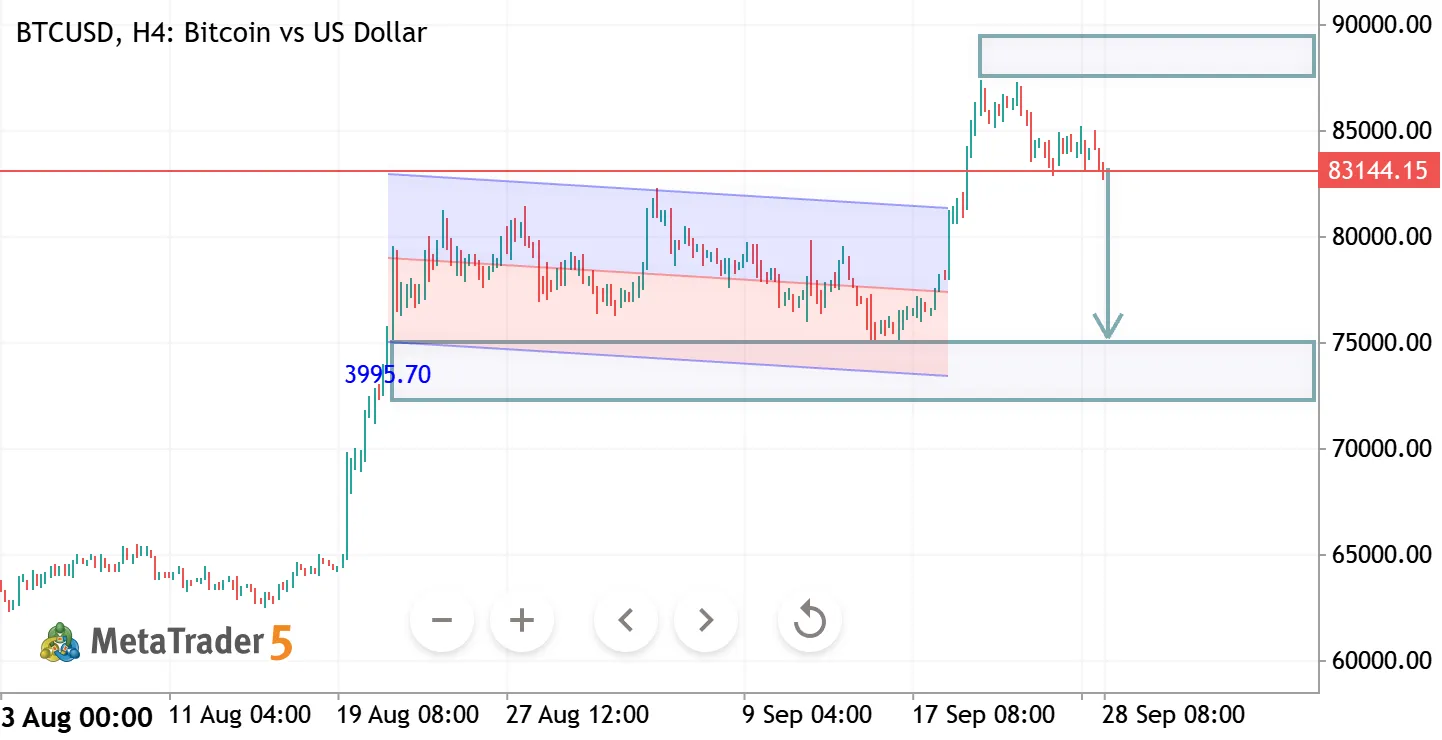
BTCUSD H4 ANALYSIS
GBPUSD – Technical Analysis 📊
GBPUSD is showing signs of a potential bullish reversal after moving within a descending channel. Price is holding around 1.3230, with the chart indicating a possible move toward the 1.3380–1.3400 resistance zone.
🔹 Support: 1.3200–1.3230 🔹 Target Zone: 1.3380–1.3400 🔹 Key Level: Sustained strength above 1.3260 would support the bullish setup.
Disclaimer: Technical analysis is based on chart structure and is not financial advice.
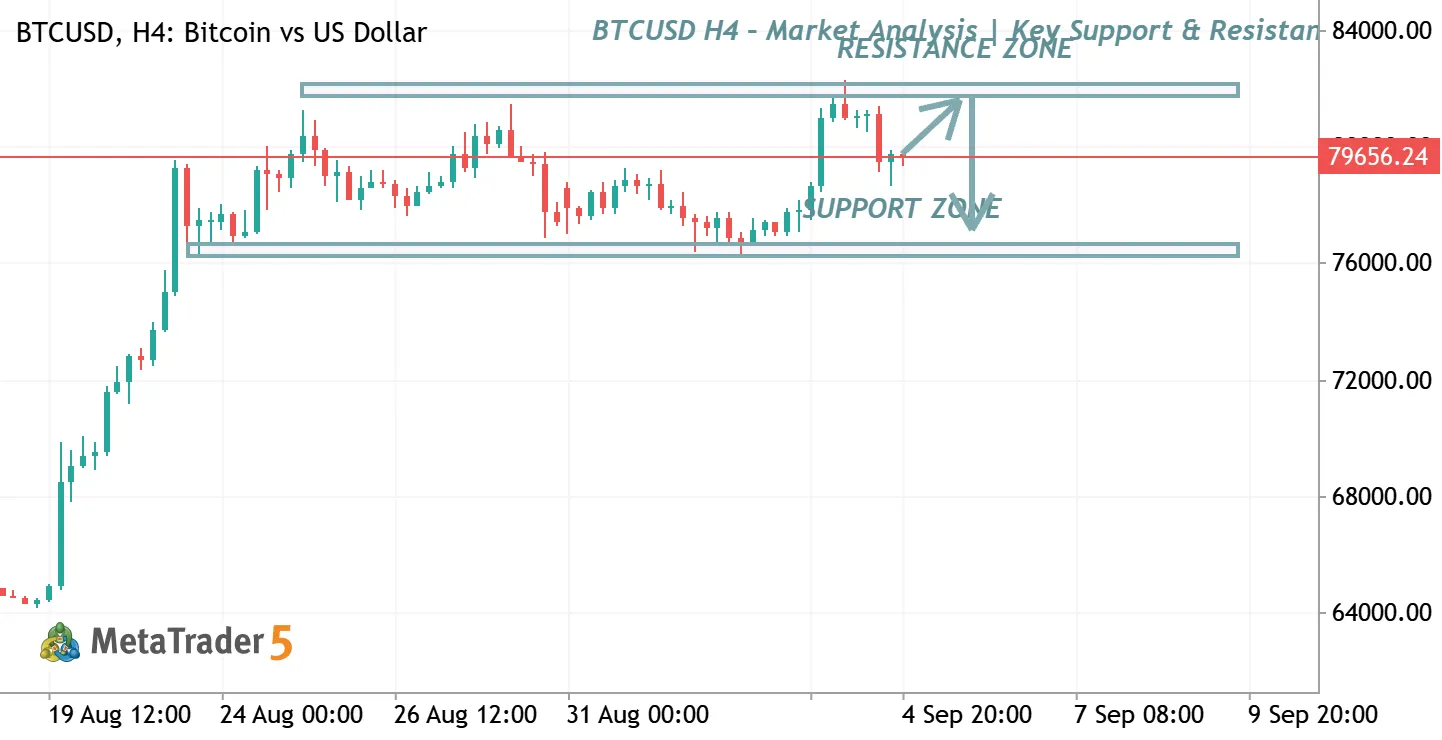
BTCUSD H4 – Market Analysis | Key Support & Resistance
BTCUSD is currently trading between important support and resistance zones on the H4 timeframe. Price is approaching a critical area where traders should watch for confirmation of either a bullish breakout toward the resistance zone or a bearish rejection toward support . 📈 Bullish Scenario: Break and hold above resistance may open the way for further upside.
📉 Bearish Scenario: Rejection from resistance could lead price back toward the major support zone. ⚠️ Trade with proper risk management and wait for confirmation before entering


The BTCUSD doesn’t have other trading ideas at this time
Browse ready-made trading ideas or select a symbol and create your own
Go to Charts and Trading Ideas