GBPUSD H1 ANALYSIS GBPUSD Pound Sterling vs US Dollar
GBPUSD H1 ANALYSIS
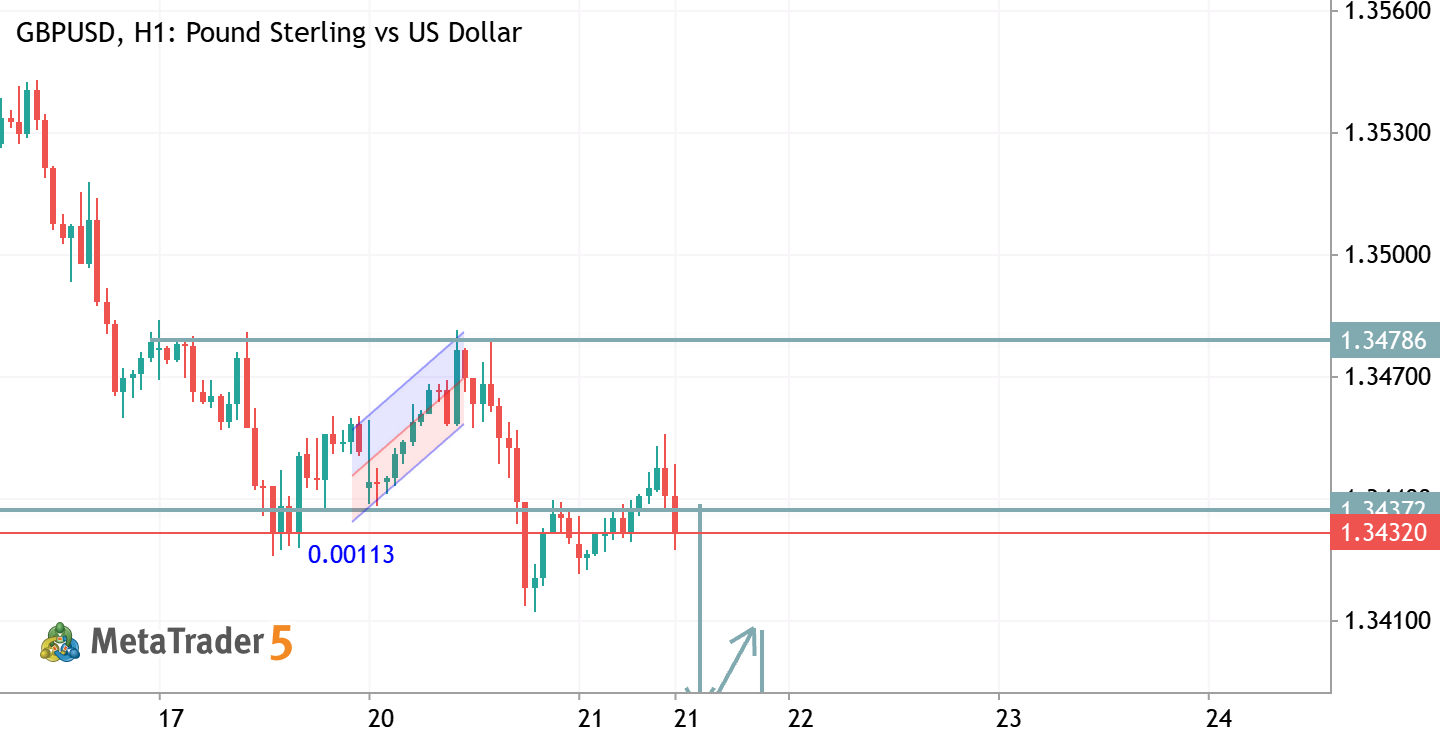
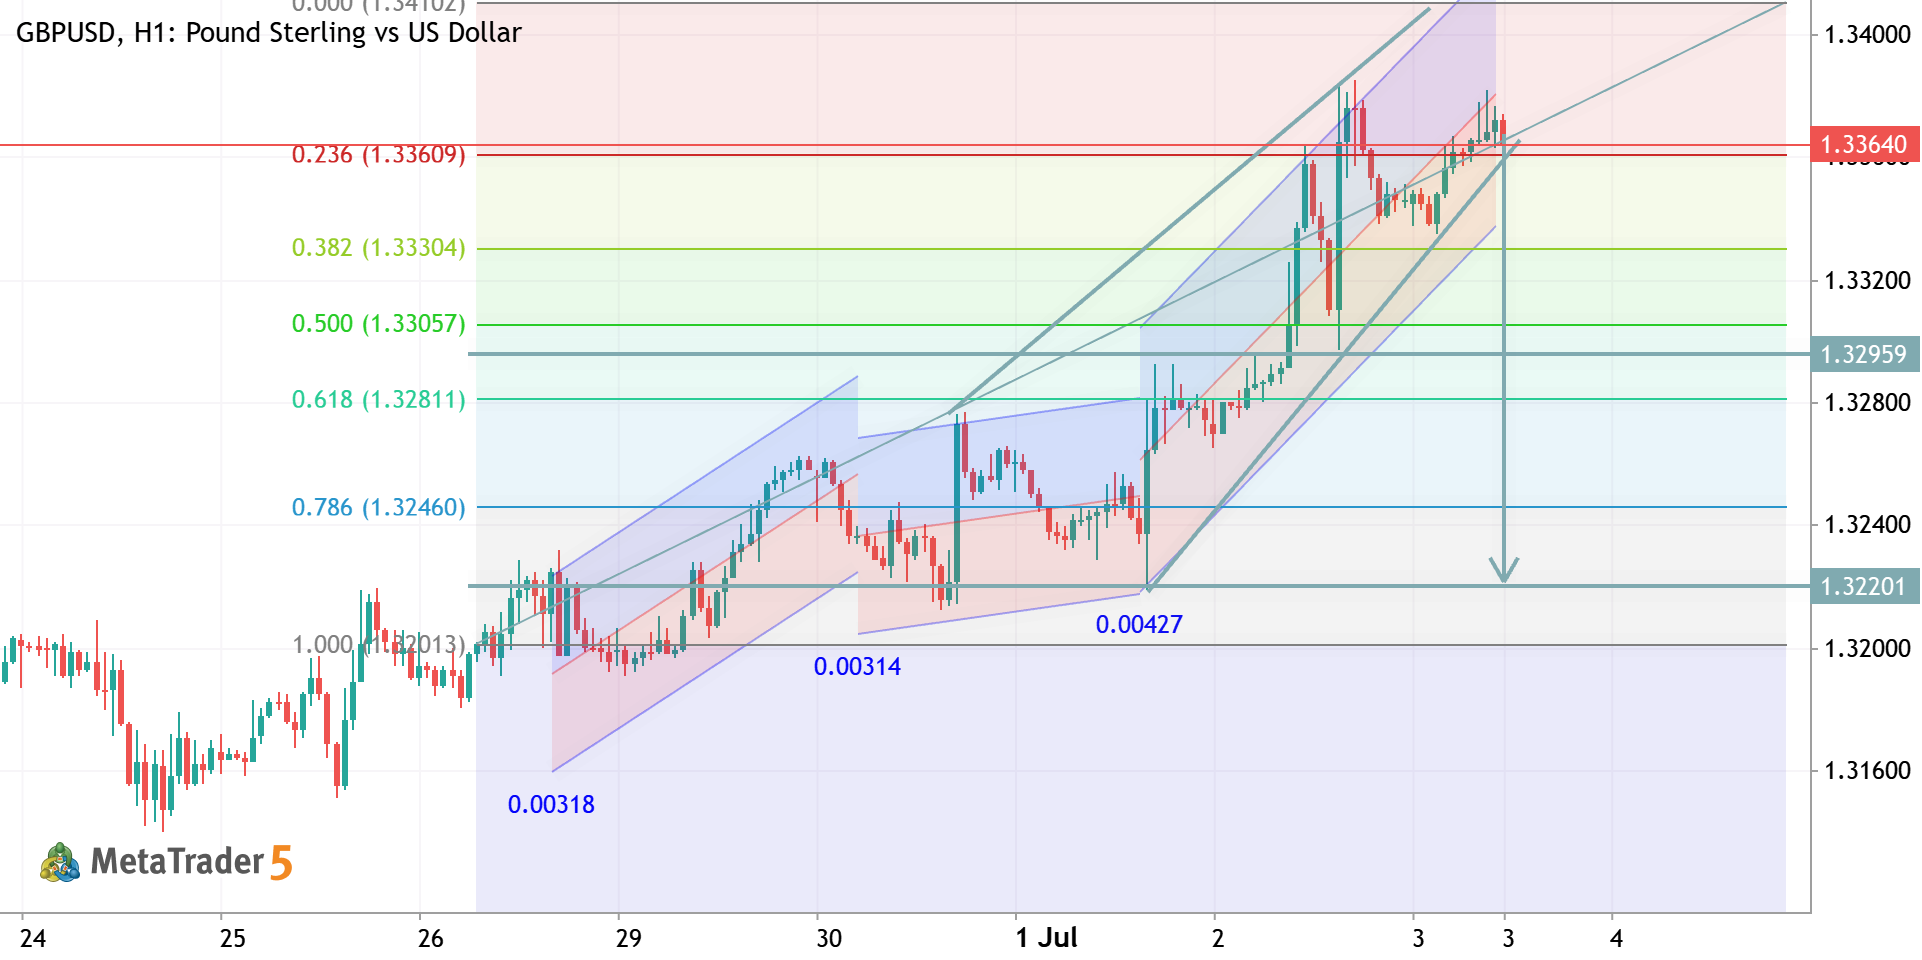
GBPUSD | H1 Analysis Price has completed a corrective move and is now breaking out of a bullish channel. The recent rebound from support and strong momentum above the Fibonacci mid-level suggest buyers are back in control. 📈 Bullish Target: A sustained move above 1.3240 could drive price toward the 1.3320 – 1.3350 resistance zone. ⚠️ Risk: A drop back below 1.3200 may weaken the bullish structure and trigger a deeper pullback. Bias: Bullish 🚀 | Trend favors upside continuation while above key support.
0
Goldanalysisteam Abdul Qayoom 2026.06.22 10:10
EURUSD H4 ANALYSIS EURUSD Euro vs US Dollar
EURUSD H4 ANALYSIS
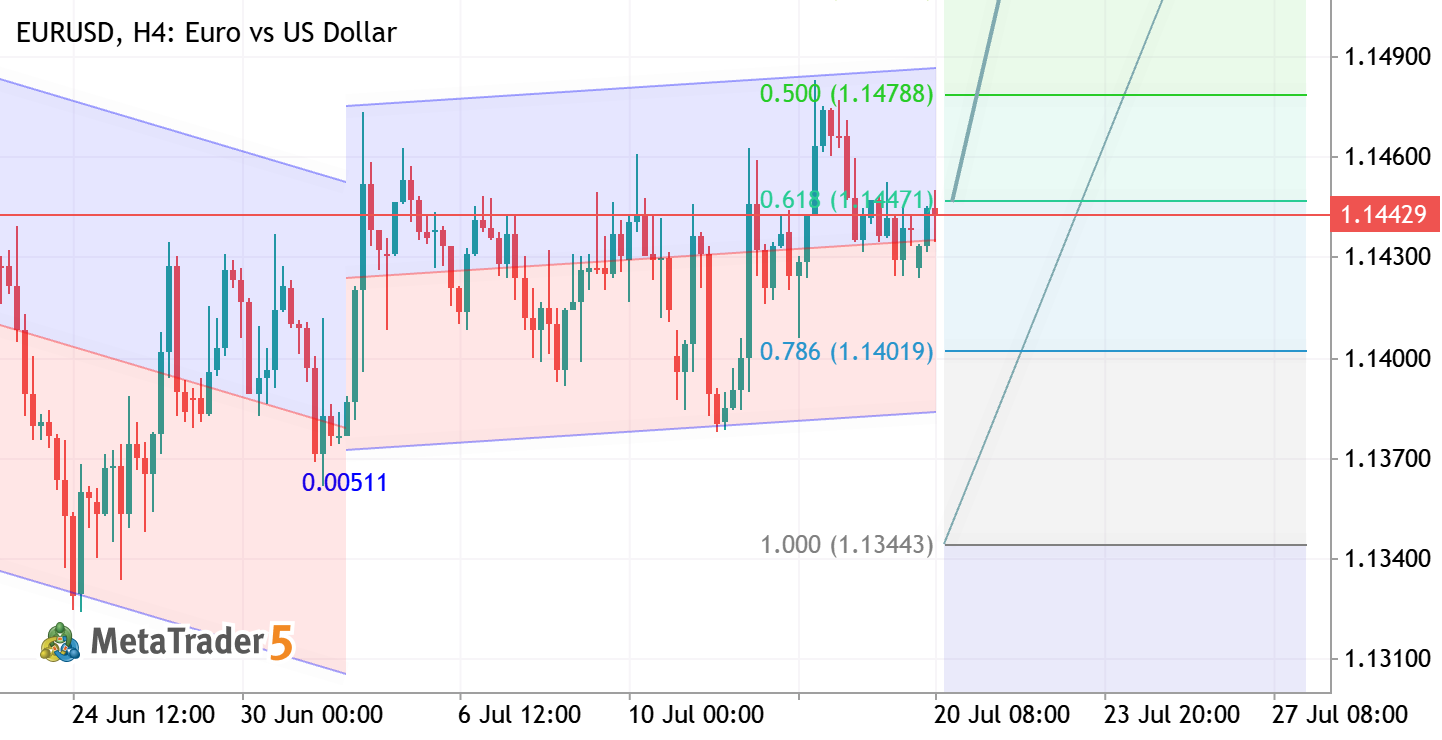
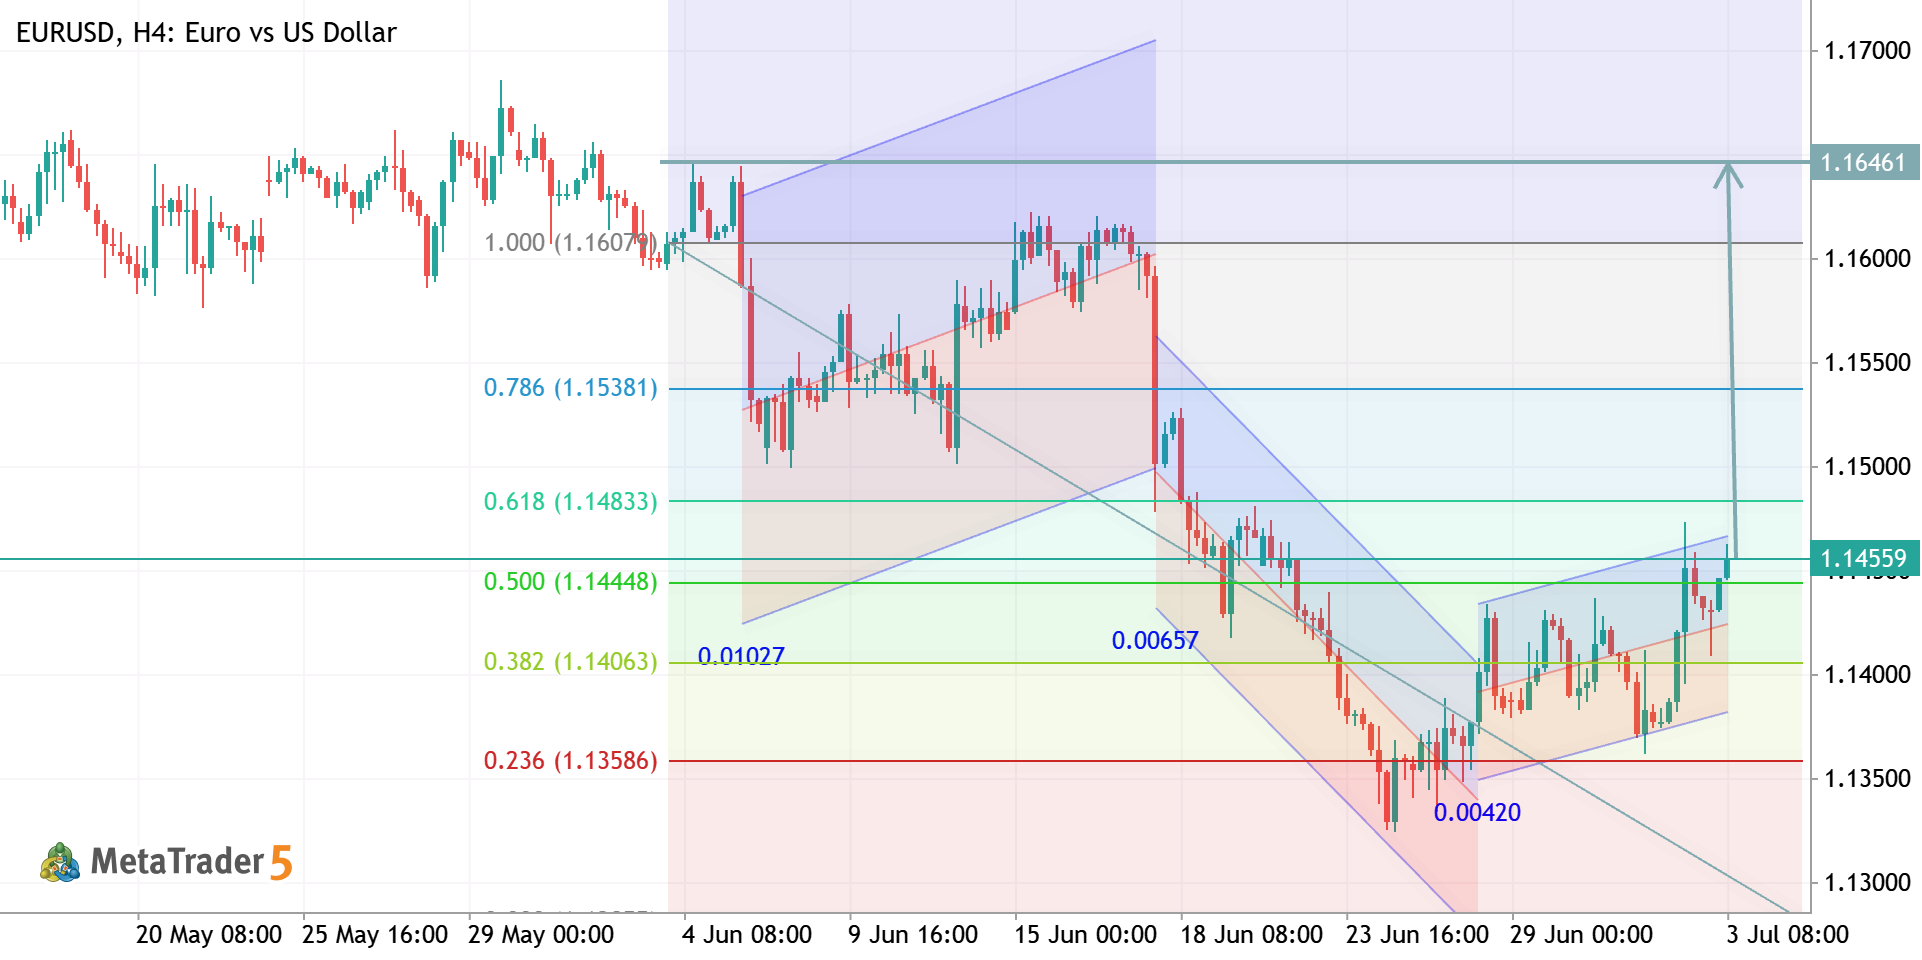
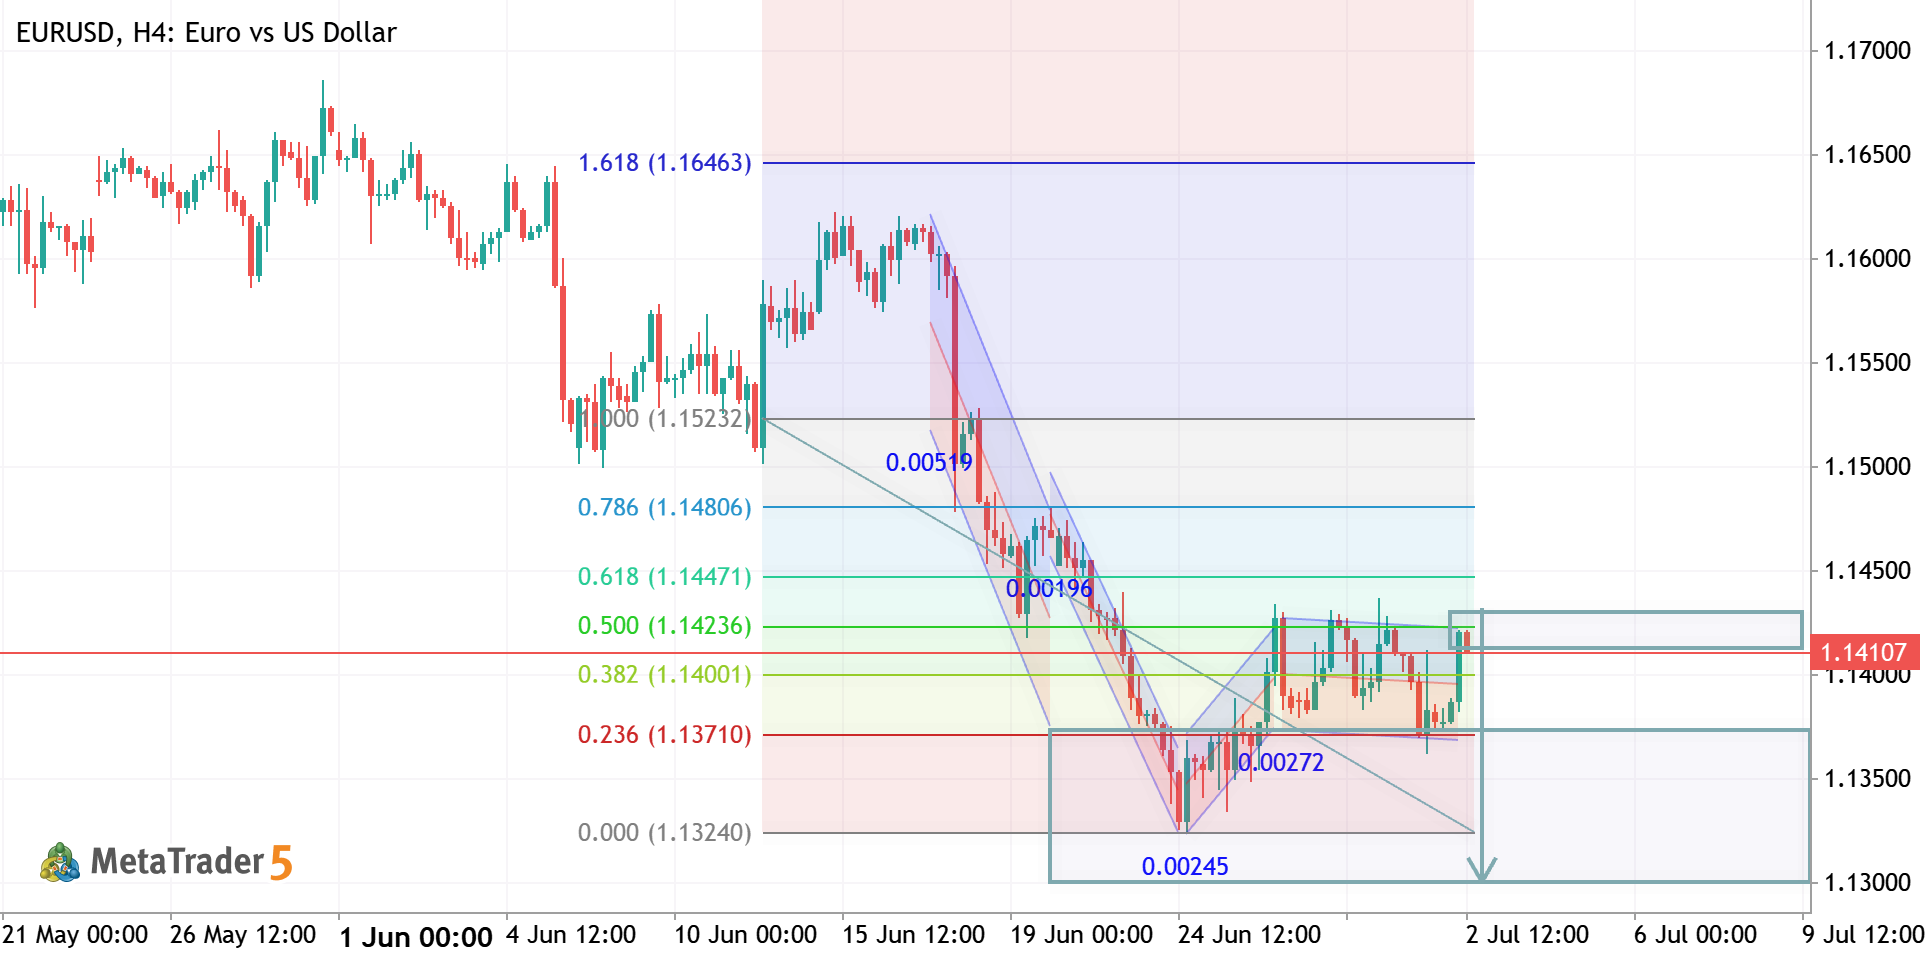
EURUSD | H4 Analysis Price is trading inside a broad range and has recently bounced from key support near 1.1450. The Fibonacci retracement shows buyers regaining control, with price targeting the upper resistance zone around 1.1660. 📈 Bullish Outlook: Holding above support keeps the path open for a move toward 1.1660+. ⚠️ Invalidation: A break below 1.1450 could shift momentum back to the downside. Bias: Bullish | Buying pressure remains strong above support. 🚀
3
Goldanalysisteam Abdul Qayoom 2026.06.22 10:00
GBPUSD - Daily Trading Forecast GBPUSD Short Pound Sterling vs US Dollar
GBPUSD - Daily Trading Forecast
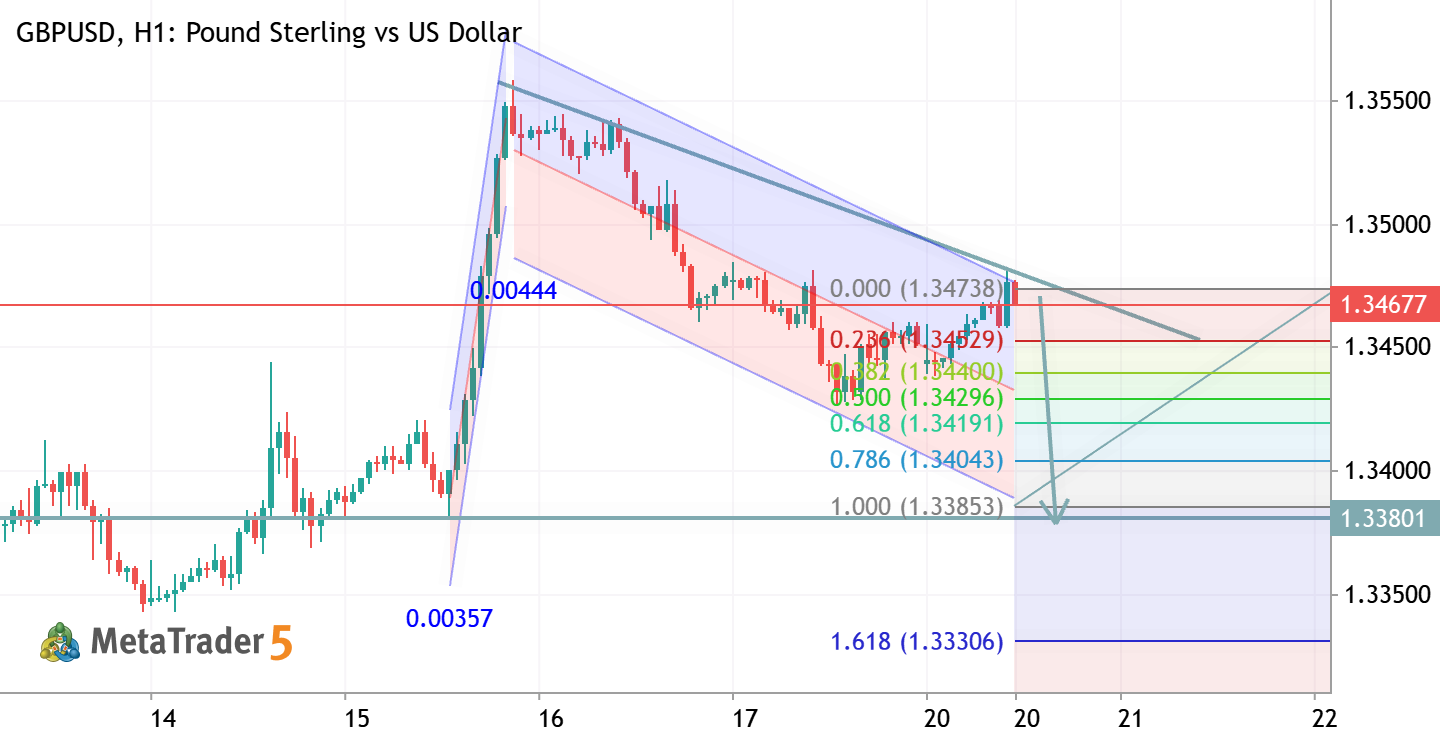
Daily price broke 200 SMA for the primary bearish reversal. The price is trying to cross the support level at 1.3192 for the bearish trend to be continuing. If the price breaks resistance level at 1.3461 together with 200 SMA to above so the primary bullish reversal will be started with 1.3658 possible target to re-enter. If the price crosses the support level at 1.3192 and support level at 1.3158 as well to below so the bearish trend will be continuing with 1.3009 possible global target. Alternatively, the price will be on secondary ranging within the primary bearish trend waiting for the direction of the bullish reversal to be started or the strong bearish trend to be continuing. Trading Summary : bearish breakdown; ready for the bear market rally to be started.
1
newdigital Sergey Golubev 2026.06.20 17:31
GBPUSD TRADE IDEA GBPUSD Long Pound Sterling vs US Dollar
GBPUSD TRADE IDEA
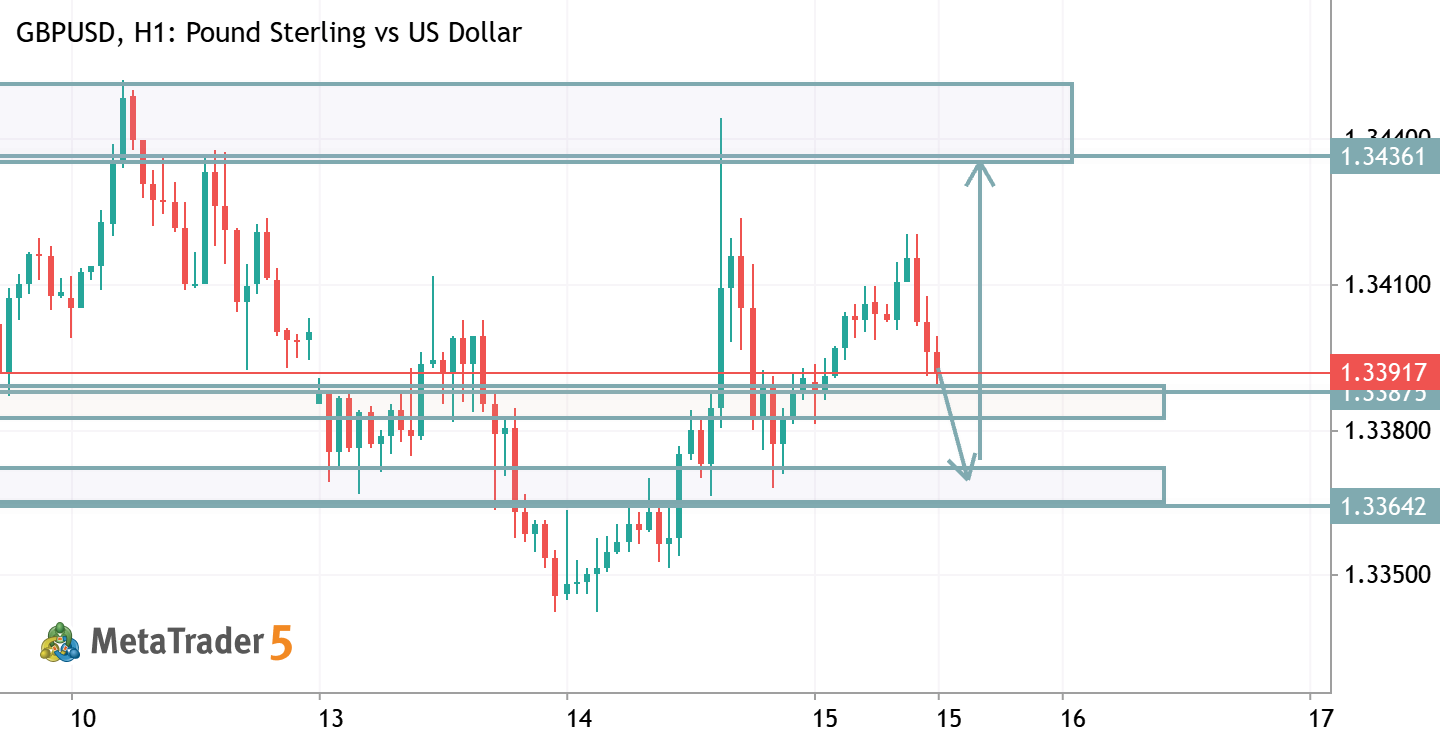
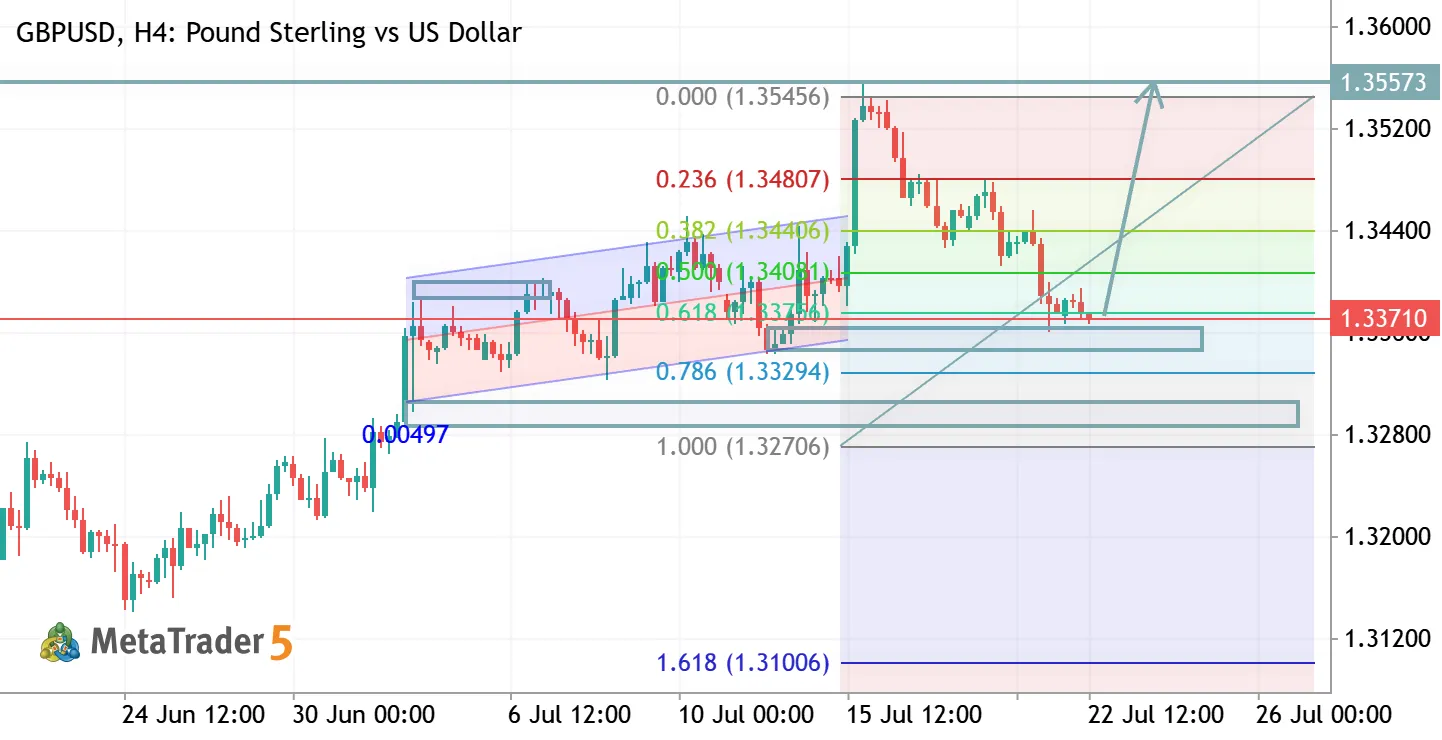
GBPUSD H4 – Bias: 🟢 Bullish Price is moving inside an ascending channel after a strong rebound from the 1.3320 support zone . Buyers are testing the key resistance at 1.3416 . A breakout and close above 1.3416 could push GBPUSD toward 1.3470 and 1.3530 . Buy Setup Entry: Above 1.3416 Target 1: 1.3470 Target 2: 1.3530 Stop Loss: Below 1.3360 Bearish Risk Rejection from 1.3416 may lead to a pullback toward 1.3360 and 1.3320 . Conclusion: Short-term momentum remains bullish while price stays above 1.3360 . A confirmed breakout above 1.3416 favors further upside. 📈
0
HamadJatoi Hamad Jatoi 2026.06.10 13:49
GBPUSD TRADE IDEA GBPUSD Long Pound Sterling vs US Dollar
GBPUSD TRADE IDEA
Entry: 1.3415 – 1.3430 Stop Loss: 1.3390 (below support) Take Profit 1: 1.3470 Take Profit 2: 1.3525 Reasoning Price is holding above the key support zone around 1.3400–1.3415 . Multiple rejections from lower levels suggest buyers are defending the area. Resistance remains near 1.3470 , offering a reasonable short-term upside target. Trade Bias ✅ Short-term Buy while price remains above 1.3400 . If an H4 candle closes below 1.3400 , invalidate the buy setup and look for selling opportunities toward 1.3365 .
1
HamadJatoi Hamad Jatoi 2026.06.04 07:56
GBPUSD TRADE IDEA GBPUSD Long Pound Sterling vs US Dollar
GBPUSD TRADE IDEA
Market Structure Price is trading around 1.3460 and has formed a series of higher lows , indicating short-term bullish momentum. An ascending trendline is supporting the recent move higher. Price is consolidating just below a key resistance zone. Key Levels Support: 1.3400–1.3410 Immediate Support: 1.3440–1.3460 Resistance 1: 1.3490–1.3500 Resistance 2: 1.3520–1.3530 Major Resistance: 1.3550+ Bullish Scenario A sustained break and H4 close above 1.3490–1.3500 could trigger a move toward: 1.3525 1.3550 The rising trendline suggests buyers remain in control while price holds above 1.3400 . Bearish Scenario Rejection from the resistance zone could push price back toward: 1.3440 1.3410 A break below 1.3400 would weaken the bullish structure and expose lower levels. Trading Bias Short-term
0
HamadJatoi Hamad Jatoi 2026.06.02 04:50
USDCHF - Daily Trading Forecast USDCHF Short US Dollar vs Swiss Franc
USDCHF - Daily Trading Forecast
Chinkou Span line of Ichimoku indicator is breaking historical price to below together with the daily price which was broke Ichimoku cloud to below as well for the primary bearish reversal. If the price crosses support level at 0.7806 to below on the close daily bar with 0.7760 possible target to re-enter so the bearish trend will be continuing. If the price breaks 0.7924 resistance level to above so the primary bullish reversal will be resumed. Alternatively, the price will be on ranging within s/r channel for direction. Trading Summary : possible bearish trend to be continuing
1
newdigital Sergey Golubev 2026.05.31 08:26
GBPUSD TRADE IDEA GBPUSD Long Pound Sterling vs US Dollar
GBPUSD TRADE IDEA
strong bullish recovery after the sharp selloff toward the 1.3310 zone. Price has formed an ascending structure with higher lows, and buyers are now testing a key resistance area around 1.3490–1.3505. The current breakout attempt above the consolidation range suggests bullish momentum is increasing. If buyers maintain control above 1.3500, the next upside targets are: 1.3545 1.3590 1.3630 The drawn projection on the chart also supports a continuation toward the upper resistance zone near 1.3600+. Immediate support levels: 1.3450 1.3435 1.3400 A rejection below 1.3450 could trigger another pullback toward the lower demand area before continuation. Market structure remains short-term bullish while price holds above the rising trendline and breakout zone. Momentum traders may look for buy
0
HamadJatoi Hamad Jatoi 2026.05.25 13:39
EURCHF - Daily Bearish Reversal EURCHF Short Euro vs Swiss Franc
EURCHF - Daily Bearish Reversal
Daily price is breaking the descending triangle pattern with support at 0.9131 together with Ichimoku cloud to below for the good breakdown with the primary bearish reversal to be started. If the price breaks 0.9131 support to below on close daily bar so the primary bearish reversal will be continuing with 0.9092 level as a possible target to re-enter. If the price crosses the resistance level at 0.9175 so the primaru bulish trend will be resumed with the secondary ranging condition and with 0.9265 possible target. Alternatively, the price will be on ranging within s/r levels to be near and inside Ichimoku cloud waiting for the direction of the strong trend to be started. Trading Summary : possible daily bearish reversal
2
newdigital Sergey Golubev 2026.05.22 15:18
CADJPY - Possible Daily Breakdown with the Bearish Reversal CADJPY Short Canadian Dollar vs Yen
CADJPY - Possible Daily Breakdown with the Bearish Reversal
Daily price is located above and near Ichimoku cloud in the bullish area of the chart. The price was bounced from resistance level at 115.7 to below to cross the Ichimoku cloud border from above. Besides, the Chinkou Span line of Ichimoku indicator is breaking the historical price to below for the good breakdown to be started, and Stochastic oscillator is indicating the downtrend in the near future. If the price breaks support level at 114.5 to below so the primary bearish reversal will be started with 113.9 as a possible target. If the price crosses resistance at 115.7 to above so the primary bullish trend will be resumed with 117.5 possible target. Alternatively, the price will be on secondary ranging within s/r levels waiting for direction. Trading Summary : possible daily breakdown
0
newdigital Sergey Golubev 2026.05.22 14:51
GBPUSD TRADE IDEA GBPUSD Long Pound Sterling vs US Dollar
GBPUSD TRADE IDEA
GBP/USD is showing a short-term bullish recovery after rejecting the 1.3300 support zone. Price formed a bullish ascending triangle/wedge structure and is currently attempting a breakout above the 1.3430 resistance area. Bullish Scenario: A confirmed H4 close above 1.3430–1.3450 could push price toward 1.3510 and potentially 1.3580 resistance levels. Momentum is improving after the sharp bearish correction, and buyers are defending higher lows. Bearish Scenario: If price fails to hold above 1.3400 and breaks below the rising trendline, GBP/USD may revisit 1.3360 and 1.3300 support again. Key Resistance: 1.3430 → 1.3510 → 1.3580 Key Support: 1.3360 → 1.3300 Current structure favors cautious bullish continuation while price remains above the ascending support trendline.
0
HamadJatoi Hamad Jatoi 2026.05.20 20:16
eurusd h4 analysis EURUSD Euro vs US Dollar
eurusd h4 analysis
EURUSD H4 Analysis 📊 Price tapped a strong demand/support zone around 1.1590 – 1.1560 after a bearish move. Current structure suggests a possible bullish rebound if buyers maintain this area. 🔹 Key resistance: 1.1700 – 1.1760 🔹 Bullish confirmation above minor resistance could trigger continuation upward. 🔹 Bias remains cautiously bullish while price holds above support. 📈 Expected scenario: retracement → bullish momentum toward higher resistance zone. ⚠️ Risk management is essential — wait for confirmation before entry.
0
Goldanalysisteam Abdul Qayoom 2026.05.20 09:35