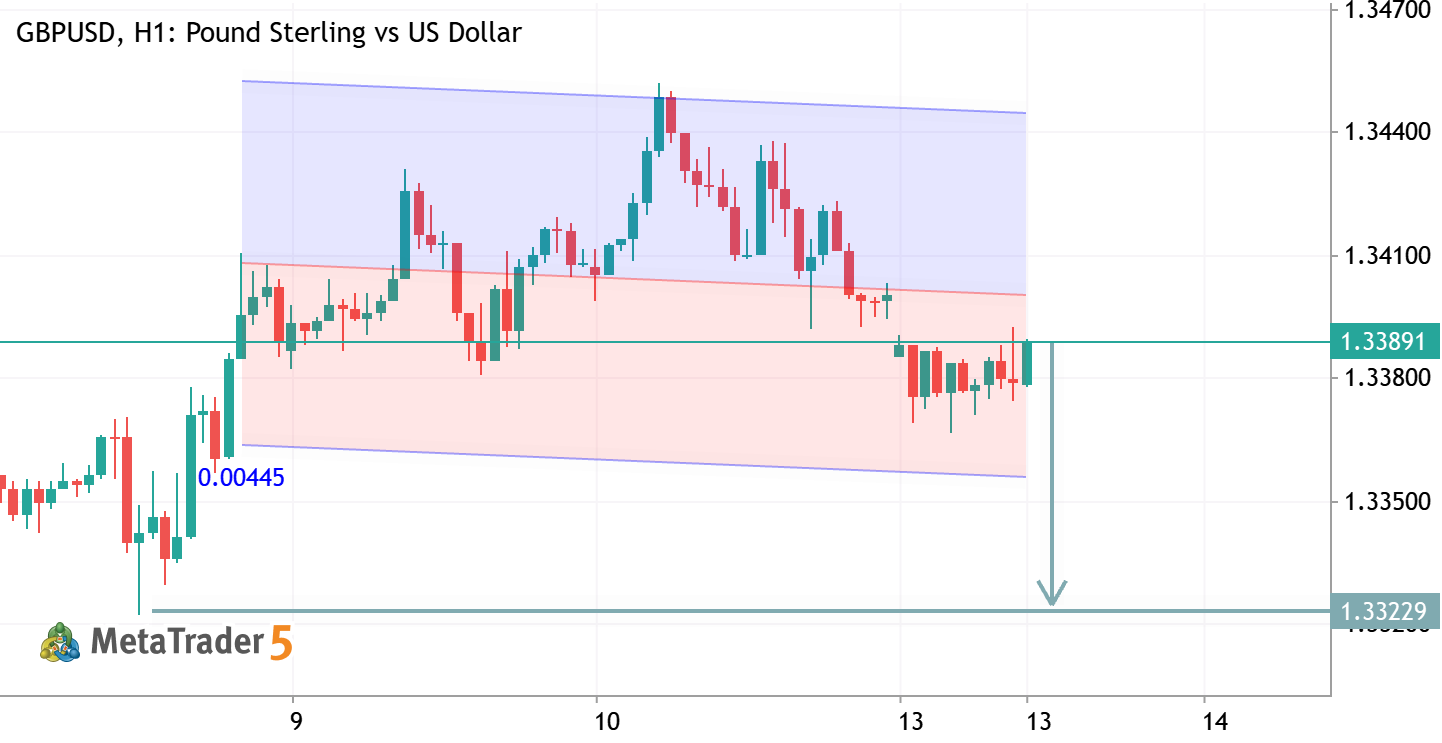
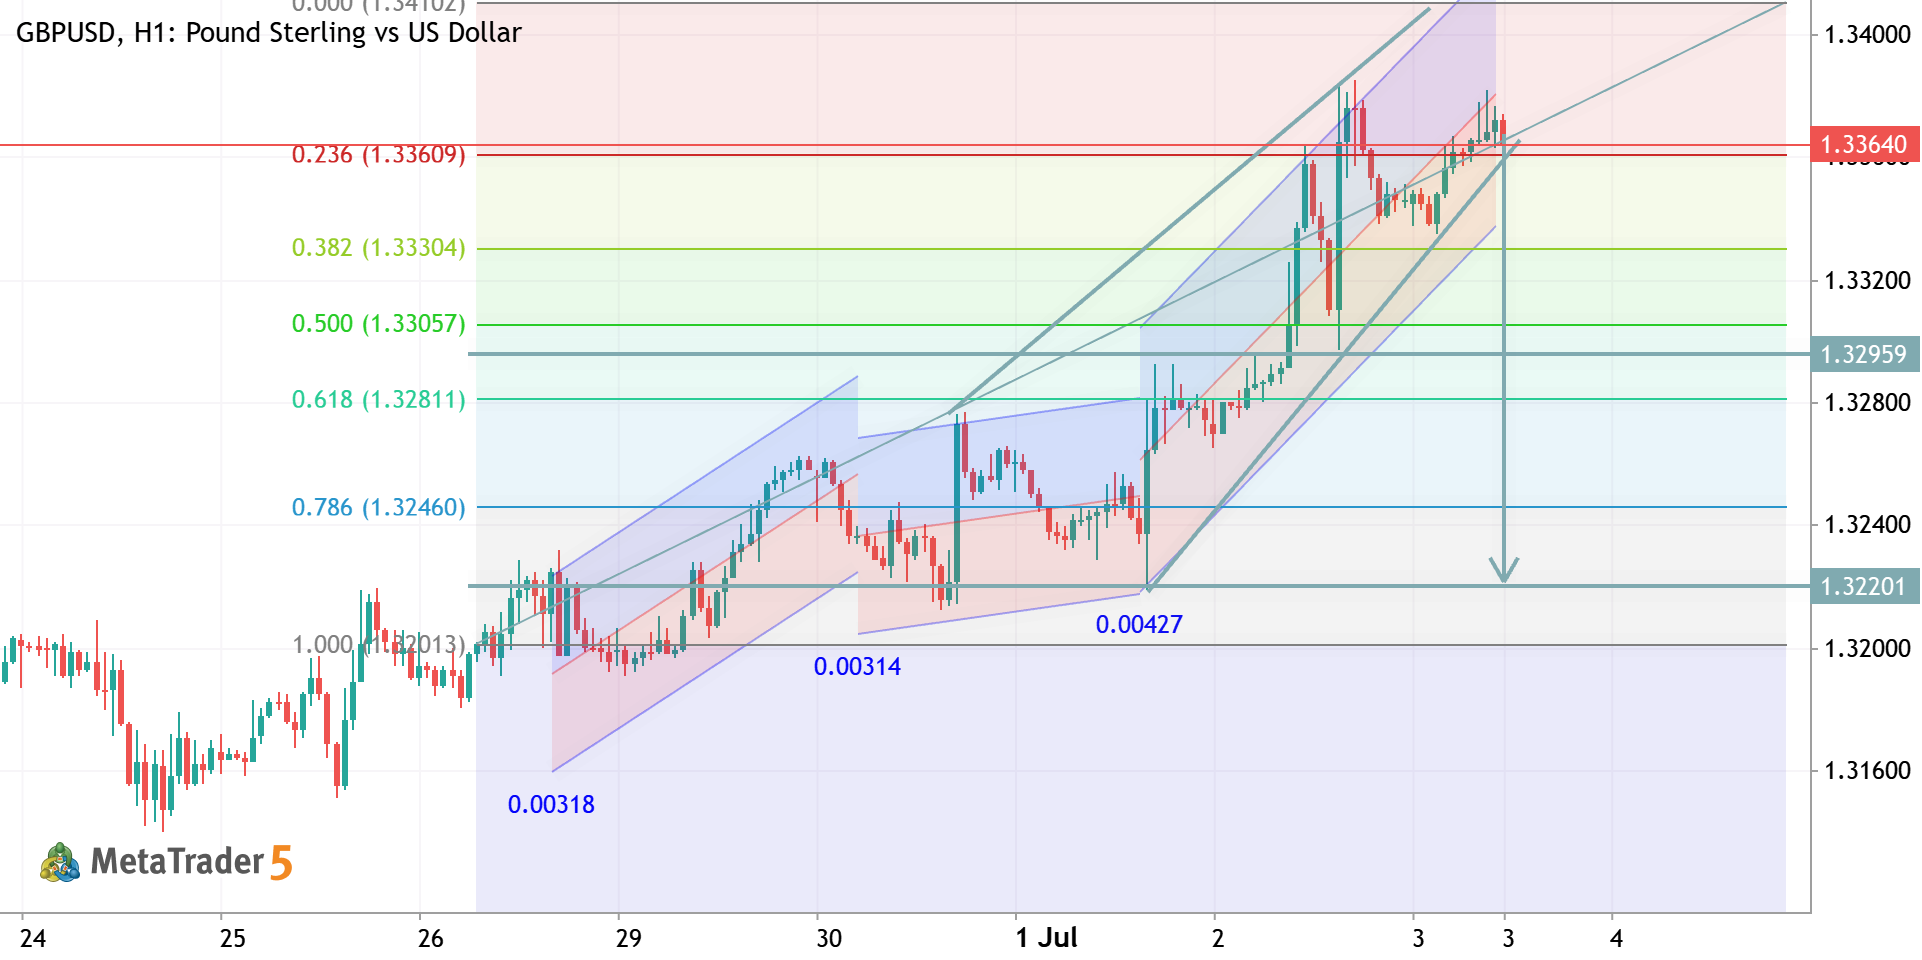
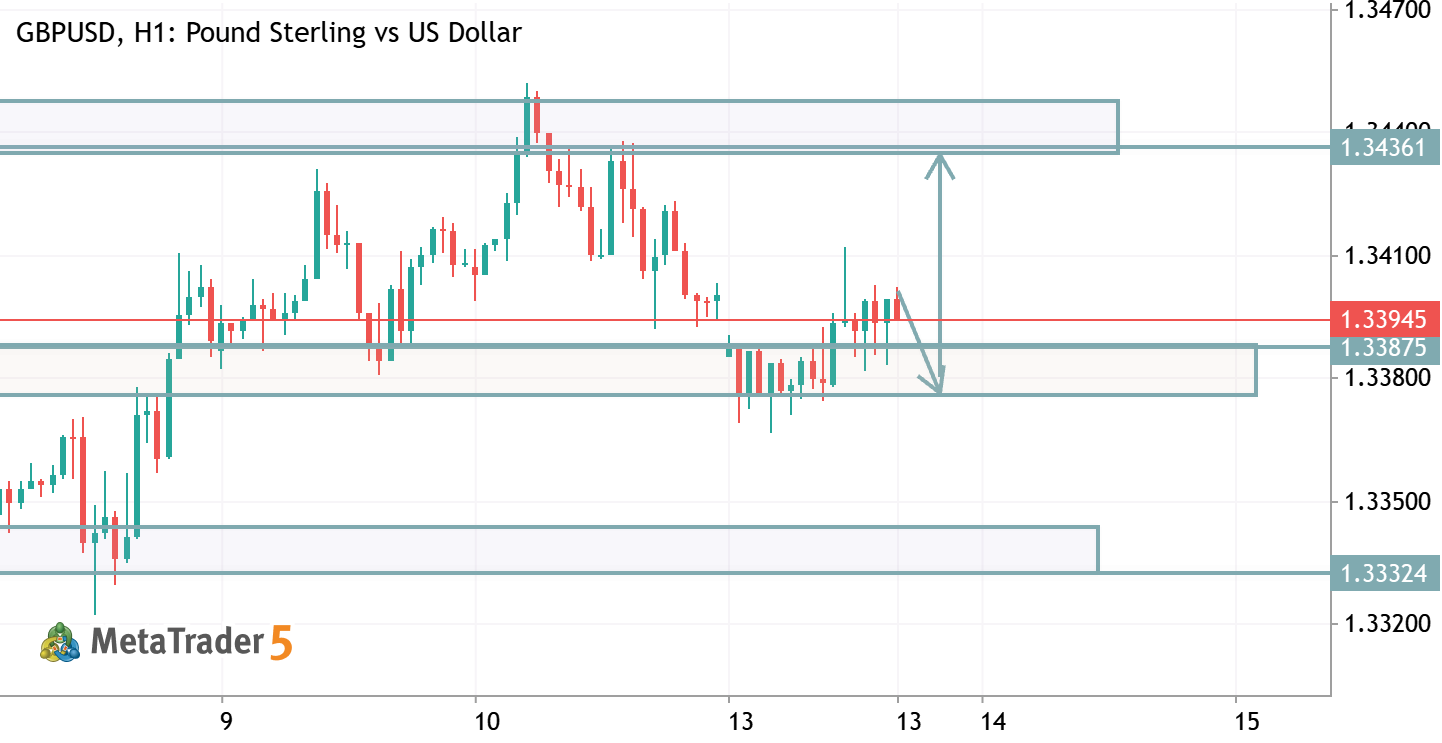
通貨

USDCHF - Long-Term Forecast USDCHF
USDCHF - Long-Term Forecast
Weekly price is located below Ichimoku cloud in the bearish area of the chart. The price is on ranging within 0.7603/0.8040 support resistance channel for direction of the breakout with the bullish reversal or for the bearish trend to be continuing. Stochastic Oscillator is showing the oversold market condition so the breakour or at least the bear market rally is very likely in the near future for example. If the price breaks 0.8040 resistance to above so the primary bullish reversal will be started with 0.8249 target to re-enter. If the price crosses the support level at 0.7603 to below so primary weekly bearish trend will be continuing. Trading Summary: waiting for direction of the strong trend to be started. 0
newdigital Sergey Golubev 2026.02.22 05:53
GBPUSD: Correction to the Bearish Reversal GBPUSD
GBPUSD: Correction to the Bearish Reversal
Daily price was bounced from resistance level at 1.3712 to below for the secondary correction within the primary bullish trend to be started. The price is testing descending triangle pattern with 1.3433 support ot below for the support level at 1.3343 as the next possible target for the primary bearish reversal. Alternatively, the price will be on secondary ranging near and above Ichimoku cloud waiting for direction of the strong trend to be started. Trading Summary: correction to the possible bearish reversal. 0
newdigital Sergey Golubev 2026.02.21 07:11
Bullish Breakout for NZDUSD NZDUSD
Bullish Breakout for NZDUSD
Chinkou Span line broke historical price to above on close weekly bar for the good bullish breakout. The price crosses Ichimoku cloud to be located in the bullish area of the chart. If the price breaks resistance at 0.6120 so the primary bullish trend will be continuing; if the price crosses 0.5927 support level to below for 0.5710 as the possible target to re-enter so the primary bearish reversal will be started; alternatively, the price will be ranging waiting for direction. 0
newdigital Sergey Golubev 2026.02.11 06:14
Trading Ideas for 2026: USDTHB - Technical Forecast and Levels USDTHB
Trading Ideas for 2026: USDTHB - Technical Forecast and Levels
Weekly price is located far below Ichimoku cloud in the bearish area of the chart. The rice is testing the descending triangle pattern with support level at 30.96 to below for the primary bearish trend to be continuing. Alternatively, the price will be on secondary ranging within 30.96/32.90 s/r channel waiting for the direction of the bullish reversal to be started or the bearish trend to be continuing. Recommendation: ranging bearish; watch the price to be crossed the s/r levels for direction. 1
newdigital Sergey Golubev 2026.01.18 08:23
Trading Ideas for 2026: USD/CAD - Technical Forecast and Levels USDCAD
Trading Ideas for 2026: USD/CAD - Technical Forecast and Levels
Weekly price is located near and below Ichimoku cloud in the bearish area of the chart. The price was bounced from 1.3642 support to break the symmetric triangle pattern to above and it was stopped near the border of Ichimoku cloud. If the price breaks the resistance level at 1.4140 so the primary bullish reversal will be started; if the price breaks support level at 1.3642 to below so the bearish trend will be continuing; if not so the price will be on ranging within s/r channel waiting for direction. 1
newdigital Sergey Golubev 2026.01.15 16:50
Trading Ideas for 2026: USDMXN - Technical Forecast and Levels USDMXN
Trading Ideas for 2026: USDMXN - Technical Forecast and Levels
MN1 price is located below Ichimoku cloud by moding along the lower border of Ichimoku channel - for the bearish trend to be continuing or for the primary bullish reversal to be started in the secondary ranging way. And chinkou Span line is almost ready to break the historical price to below for possible breakdown in the future for example. If the price breaks support level at 17.868 to below on monthly close bar so the primary bearish trend to be resumed with the good possible breakdown on lower timeframes; alternatively, the price will be on secondary ranging for direction waiting for the high impacted news events. 1
newdigital Sergey Golubev 2026.01.08 16:35
Trading Ideas for 2026: GBPUSD - Technical Forecast and Levels GBPUSD
Trading Ideas for 2026: GBPUSD - Technical Forecast and Levels
Weekly price is above 200 SMA on the bullish area of the chart. 100 SMA together with 55 SMS are indicator for the price the ranging market condition for trying to the primary bullish trend to be resumed. Ascending triangle pattern was formed, and if the price breaks resistance at 1.3534 to above so the bullish trend will be resumed. Alternatively, the price will be on secondary ranging within the primary bullish market condition. Recommendation: wait for the price to break 1.3534 resistance for possible buy position; otherwise - ranging. 1
newdigital Sergey Golubev 2026.01.08 10:38
Trading Ideas for 2026: EUR/USD - Technical Forecast and Levels EURUSD
Trading Ideas for 2026: EUR/USD - Technical Forecast and Levels
Weekly price is located above Ichimoku cloud in the primary bullish area of the chart. The price was bounced from 1.1808 resistance level to below for the ranging to the secondary correction to be started. - if the price breaks resistance level at 1.1808 on weekly close bar to above so the bullish trend will be continuing; - if the price breaks 1.1490 support to below so we ay see the the primary bearish reversal to be started; - if not so the price will be on ranging within wide support/resistance channel waiting for the direction of the strong trend. Recommendation: watch the close weekly price to break resistance at 1.1808 to above for possible buy position with 1.1918 as re-enter; otherwise - ranging. 1
newdigital Sergey Golubev 2026.01.06 10:10
Trading Ideas for 2026: GBP/USD - Technical Forecast and Levels GBPUSD
Trading Ideas for 2026: GBP/USD - Technical Forecast and Levels
<p>Weekly price is located to be above 200 SMA and 100 SMA as well in the bullish area of the chart. The price was bounced from 55 SMA to above for the primary bullish trend to be started. For now, the price is trying to break the symmetric triangle pattern to above together with resistance at 1.3438 on the weekly close bar. Alternatively, the price will be on secondary ranging within s/r levels waiting for direction of the strong trend to be started. Recommendation: watch the weekly price to break the resistance level on close bar, otherwise - ranging for direction.</p> 2
newdigital Sergey Golubev 2025.12.18 16:31
USDJPY: end of the year trading ideas USDJPY
USDJPY: end of the year trading ideas
The daily price is on secondary ranging within the primary bullish market condition: the p[rice is ranging within 154.35/156.95 support/resistance channel for waiting for the direction of the bullish tred to be continuing if the resistance at 156.95 is broken, or to the primary bearish reversal to be started for 154.35 support to be broken to below on daily close bar. Recommendation: watch the daily price 154.35/156.95 s/r channel to be broken for possible buy or sell position in the short or medium term situation for example. 2
newdigital Sergey Golubev 2025.12.18 09:58