
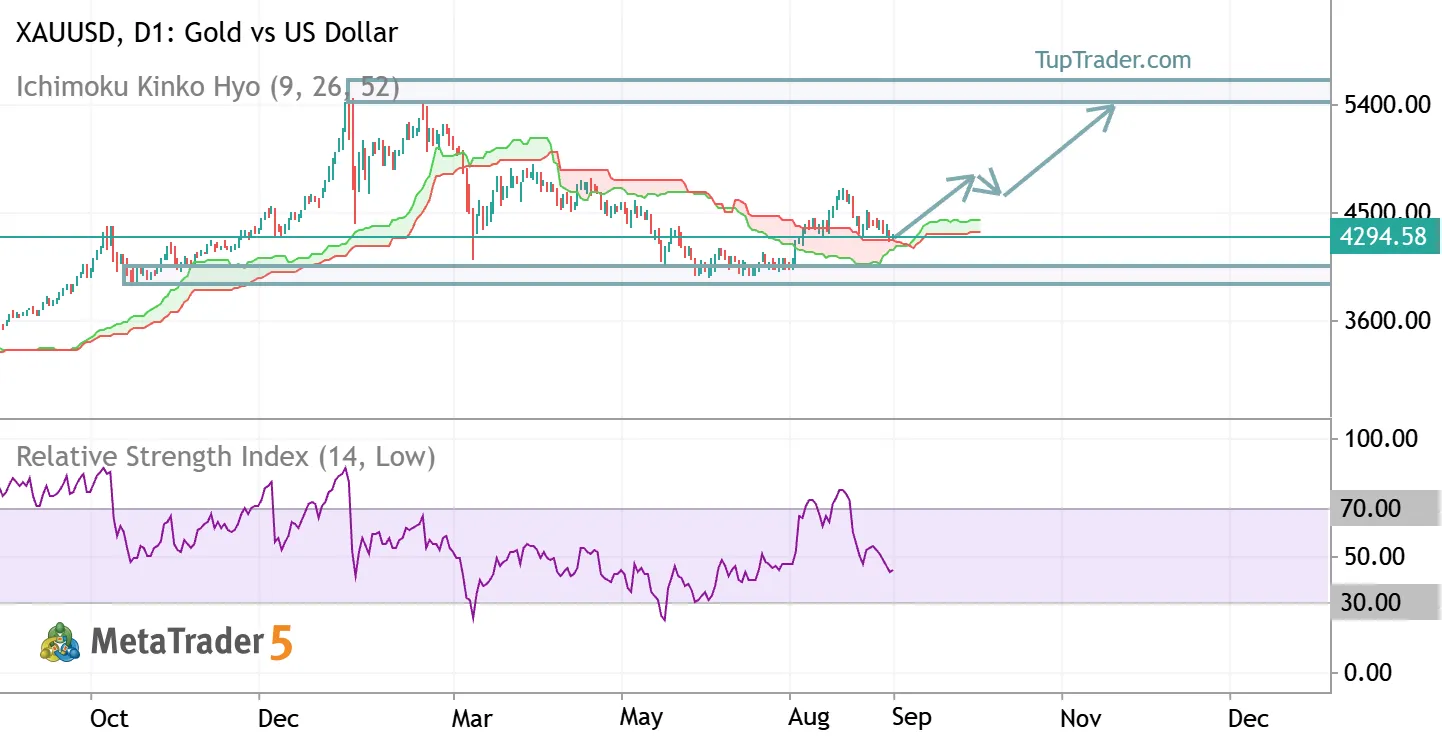
XAUUSD is at an interesting structural point on the daily chart.
Price recently broke/reclaimed the Ichimoku Kumo to the upside, rallied toward the 4,600–4,700 area, and has now pulled back toward the cloud/breakout region.
I am treating the broader structure as a long-term range:
• Lower range: ~3,900–4,050
• Mid-range: ~4,700–4,800
• Upper range: ~5,400–5,600
Bullish scenario:
If the Kumo breakout was genuine and the current pullback holds, price could rotate back toward 4,600–4,700 first. Acceptance above that area would bring the 4,700–4,800 mid-range into focus.
From the current ~4,295 area, reaching the midpoint around 4,750 would represent roughly a 10–11% move.
The upper 5,400–5,600 zone is not my immediate target. It becomes relevant only if price successfully reclaims the mid-range and establishes bullish acceptance above it.
Invalidation / bearish scenario:
If price loses the Kumo and fails to reclaim it, I would treat the recent upside break as potentially false. In that case, attention shifts back toward the 4,050–3,900 lower-range zone.
RSI is currently neither overbought nor oversold, so I would look for confirmation from price structure rather than momentum alone.
Current view: neutral-to-constructive while the Kumo retest holds; 4,700–4,800 is the key upside decision area.

 MQL5 프로필
새 코멘트