XAUUSD (Gold) Weekly Linear Regression Channel (Length 100) #2 XAUUSD Short Gold vs US Dollar
XAUUSD (Gold) Weekly Linear Regression Channel (Length 100) #2
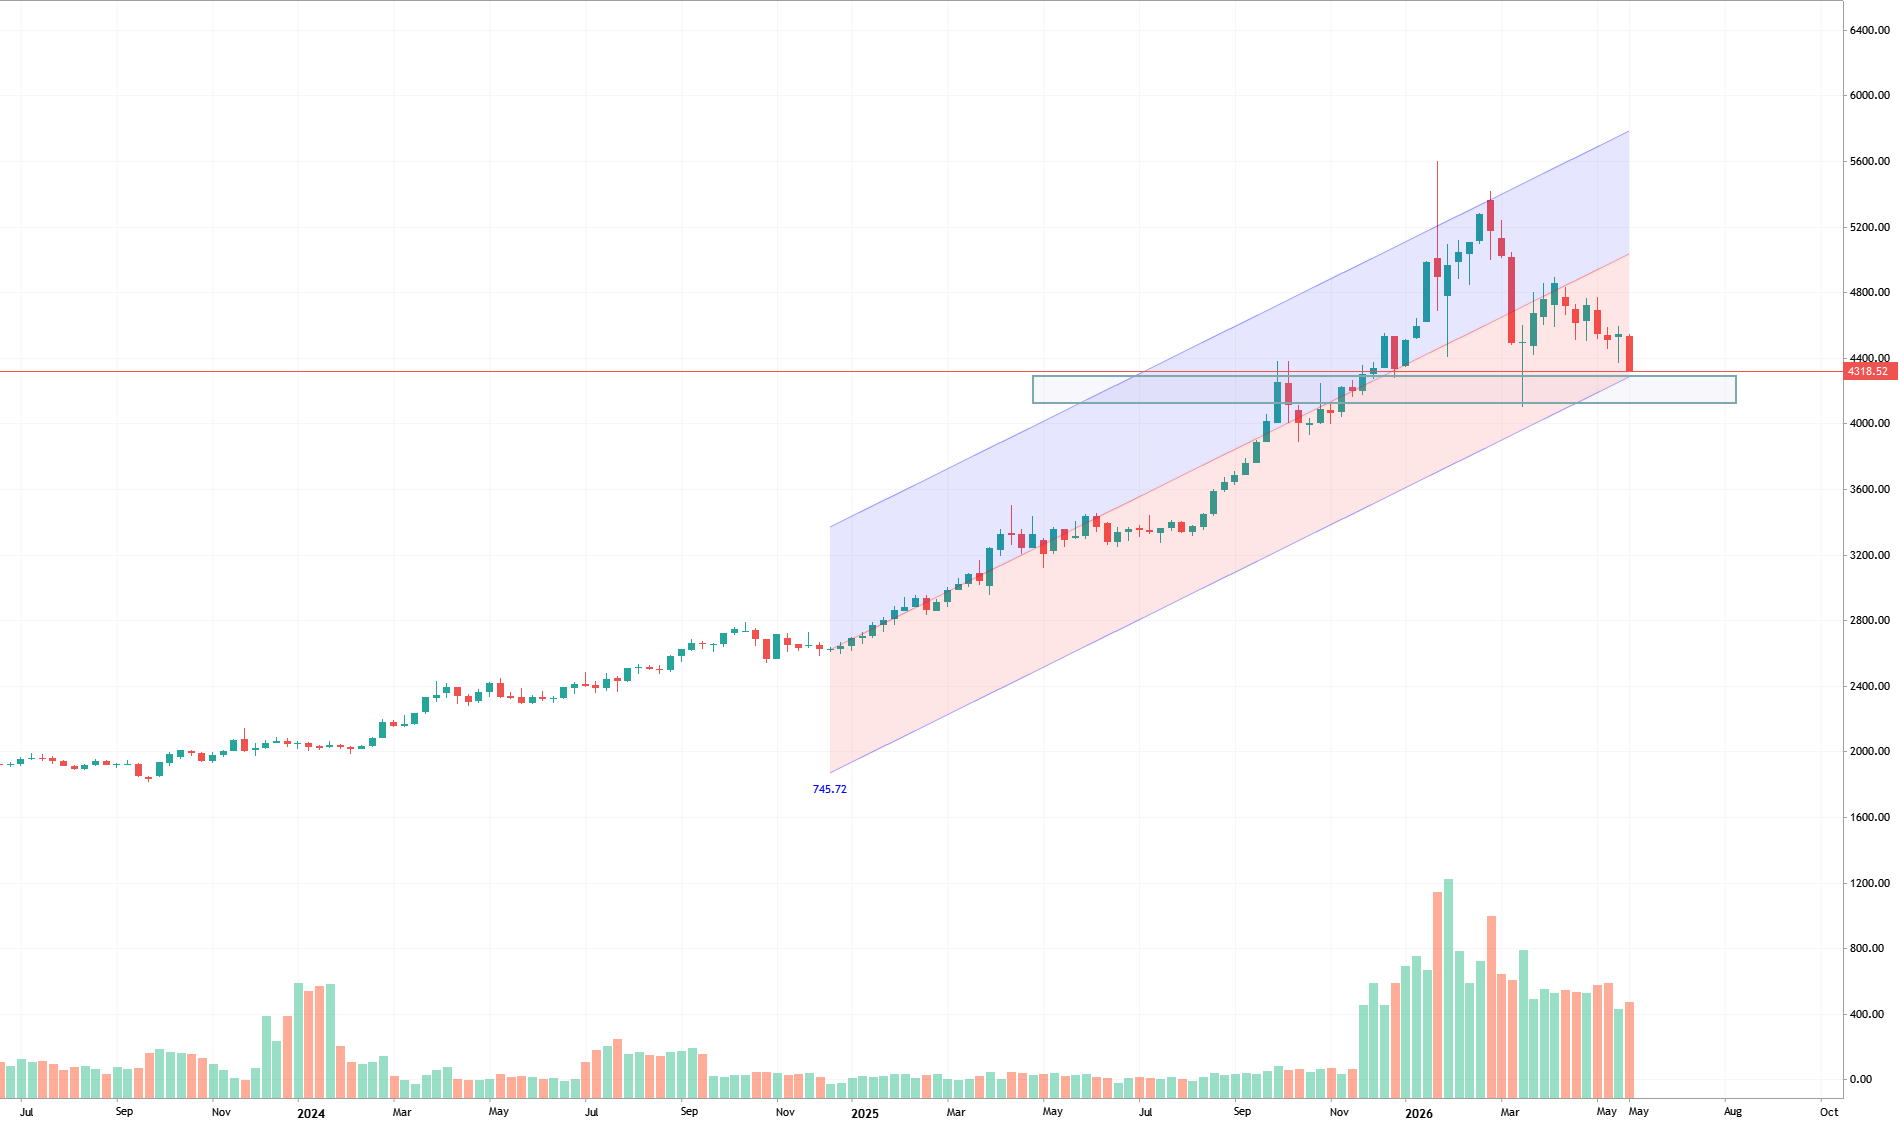
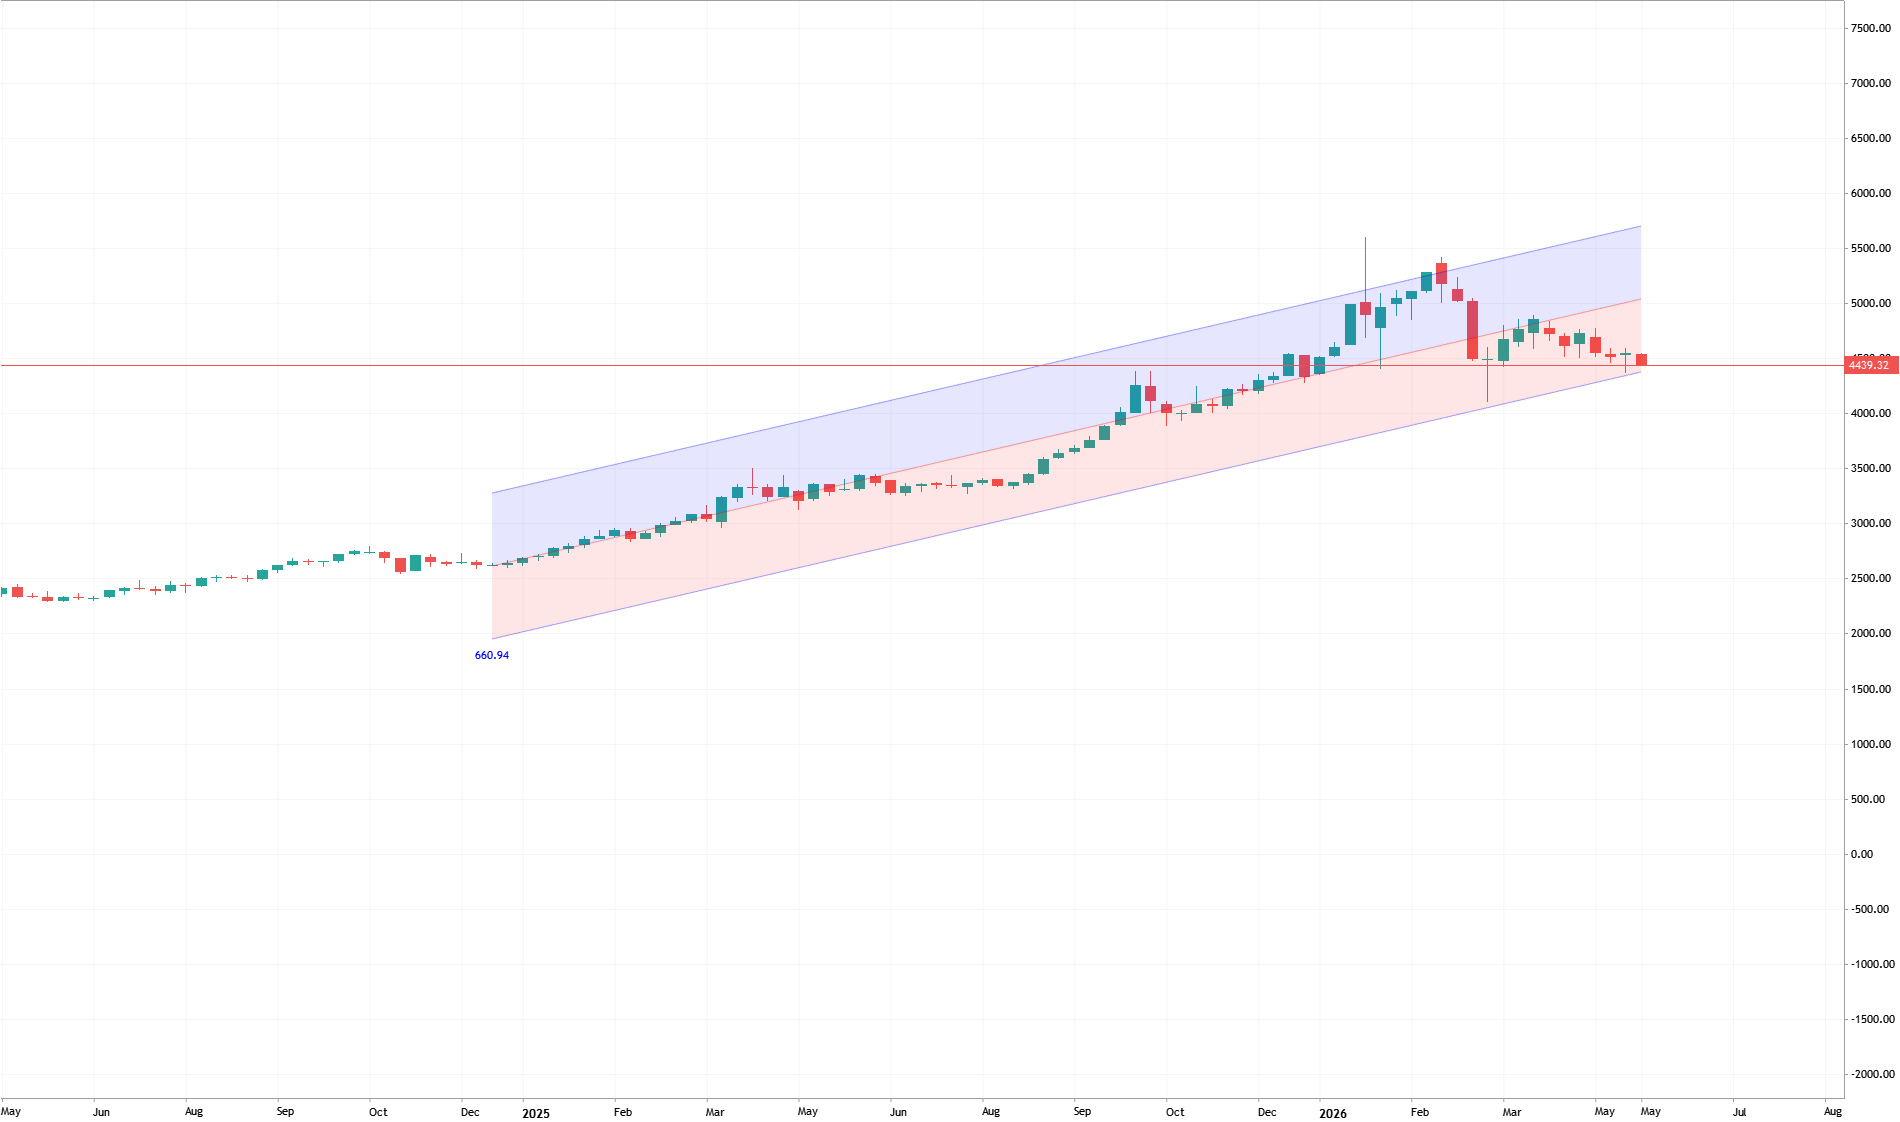
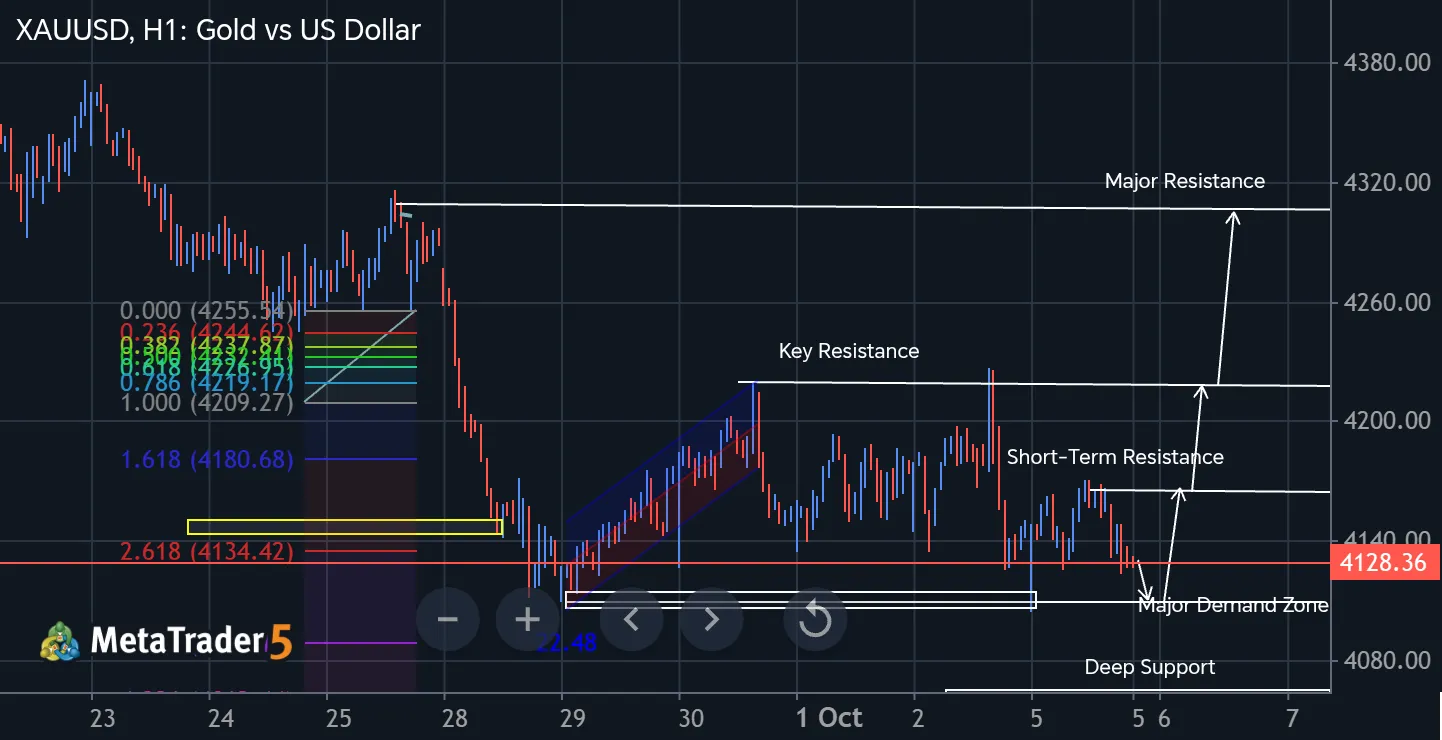
In the previous analysis, the XAUUSD weekly chart was evaluated using a Linear Regression Channel structure. At the time, bullish momentum already appeared relatively weak, and the market subsequently generated a strong bearish structural signal attempting to break below the lower boundary of the Linear Regression Channel 100. From the current structural perspective, the probability of further downside movement toward the boxed price zone marked on the chart has increased. Although short-term technical rebounds may still occur, the broader directional structure continues to favor bearish pressure for now. As a result, temporary rebound phases may continue to provide more favorable conditions for conservative short-side positioning rather than aggressive long exposure. From a long-position
0
EricYosi Koo Hotbeom 2026.06.06 15:20
Smma cross + Breakout XAUUSD Gold vs US Dollar
Smma cross + Breakout
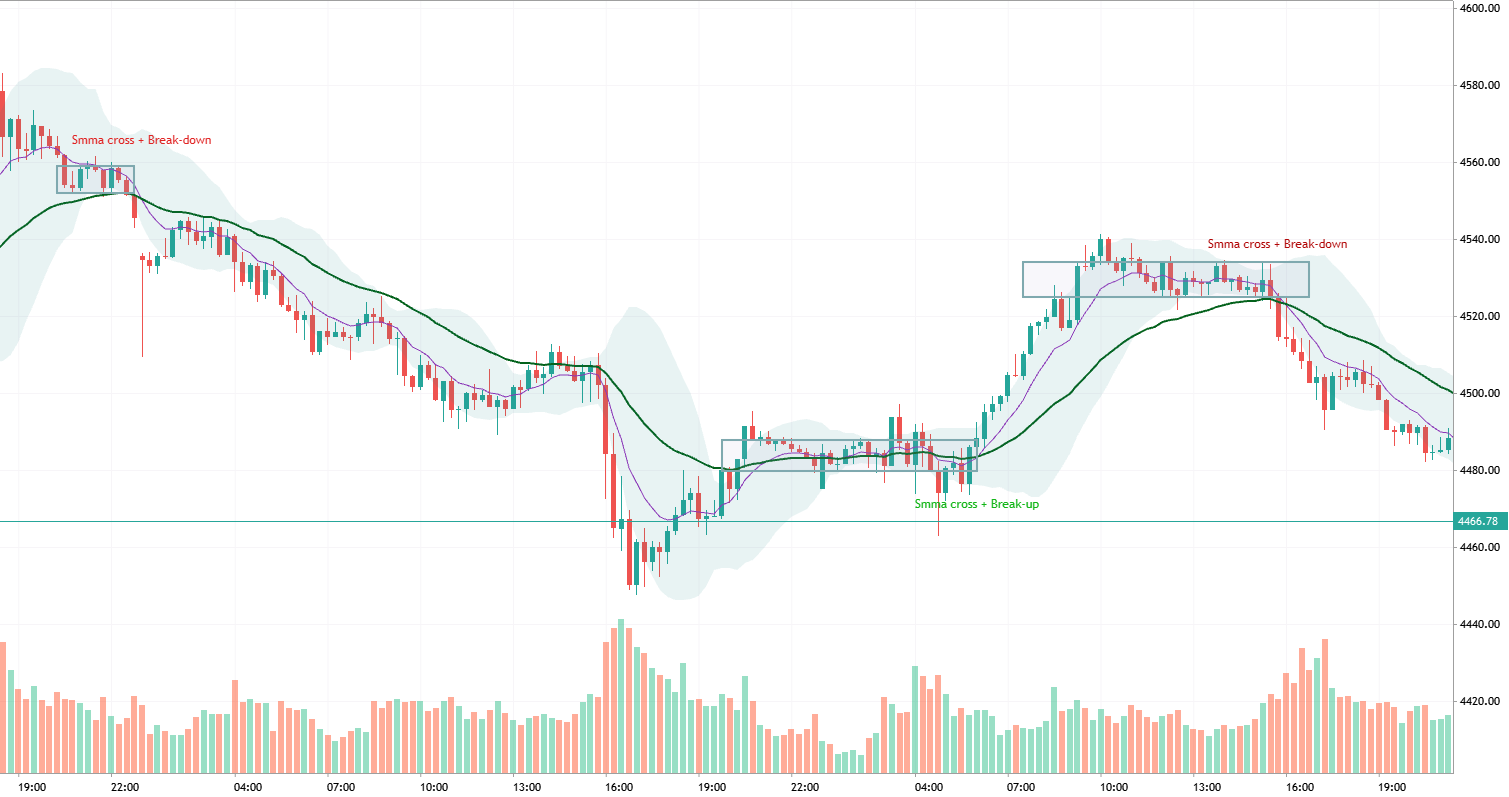
SMMA Cross + Breakout Confirmation Strategy Trading Idea Market Analysis The market is currently transitioning from consolidation into a potential trend phase. This setup combines SMMA crossover signals with range breakout confirmation to identify higher-probability trading opportunities. Bullish Scenario Fast SMMA crosses above Slow SMMA. Price consolidates within a defined range. A candle closes above resistance. Volume and momentum support the breakout. Key Levels Range Resistance: Breakout Trigger Range Support: Invalidation Level Previous Swing High: Target Area Invalidation Price closes back inside the range. Fast SMMA crosses below Slow SMMA. Bearish Scenario Fast SMMA crosses below Slow SMMA. Price consolidates before breaking support. Downside breakout confirms bearish momentum
1
atitchick atit chick 2026.06.04 09:44
XAUUSD (Gold) Weekly Linear Regression Channel (Length 100) XAUUSD Short Gold vs US Dollar
XAUUSD (Gold) Weekly Linear Regression Channel (Length 100)
1. Multi-Timeframe Diagnosis Weekly (Length 100): Price is testing the lower channel boundary (-2SD) . This is a critical macro support level determining the 2-year trend. Daily / Intraday: Strictly bearish (lower highs and lower lows). No buying pressure is observed despite hitting the weekly floor. 2. Market Outlook High Breakdown Probability: Since lower timeframes maintain strong bearish momentum, the weekly support is highly vulnerable. Expected Move: A sharp downward price extension is likely as macro support fails and triggers stop-losses. 3. Tactical Strategy No Blind Buying: Avoid catching a falling knife just because the price seems low. Short Strategy: Follow the trend and short if the price decisively closes below the weekly -2SD line. Long Strategy: Wait for confirmation. Only
0
EricYosi Koo Hotbeom 2026.06.03 17:56
Gator Oscillator - traditional general approach XAGUSD Silver vs US Dollar
Gator Oscillator - traditional general approach
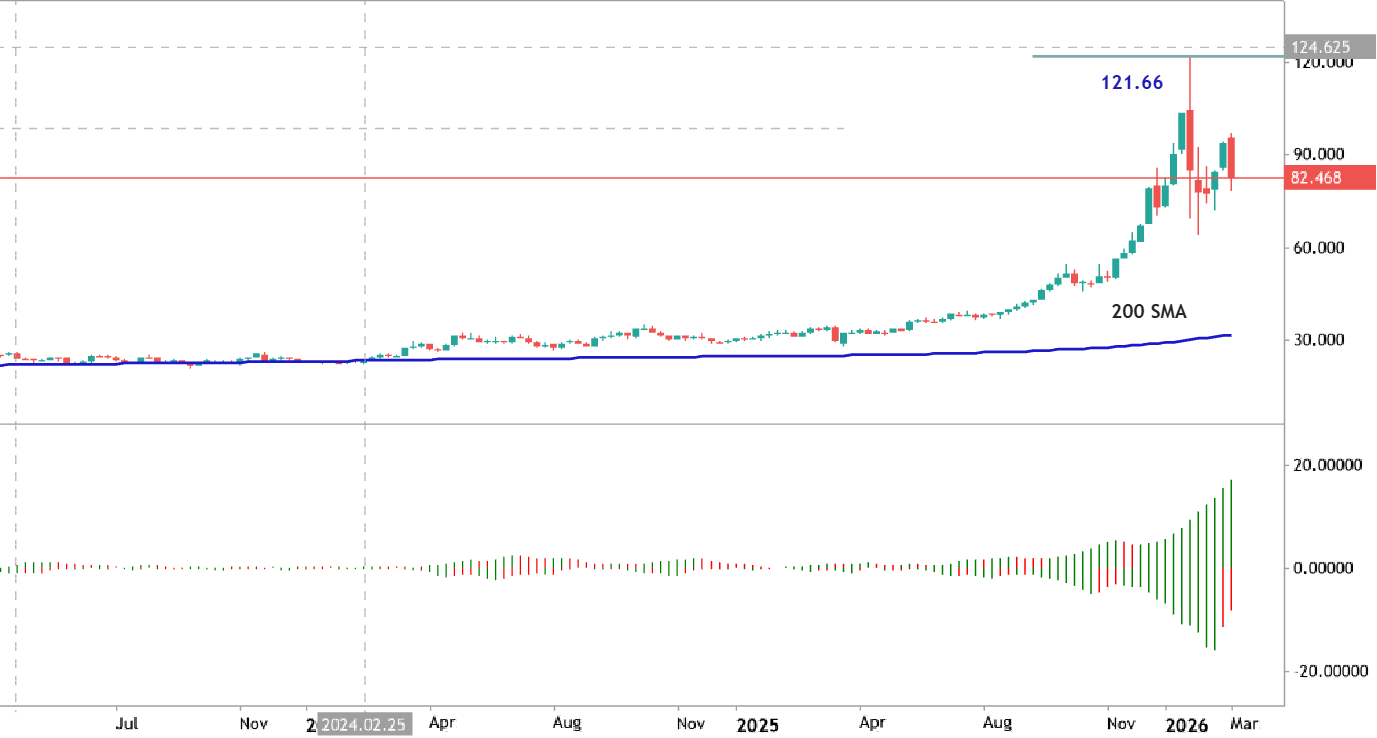
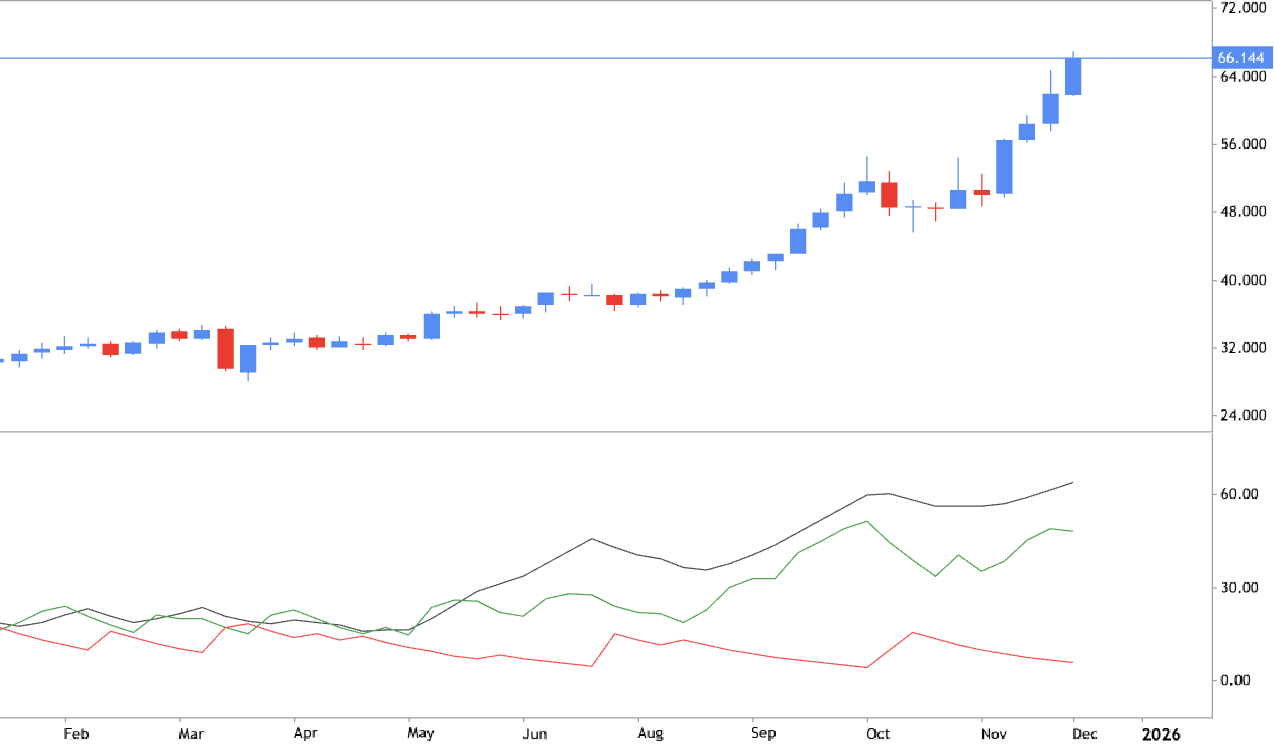
Gator Oscillator indicator was developed by Bill Williams to identify the market condition about the trend or ranging. Besides, the oscillator is measuring trend strength and identifies market phases: sleeping, awakening, eating, sated. Sleeping: Both bars are red, indicating no trend. Awakening: One bar is green, the other is red, signalling a new trend. Eating: Both bars are green, suggesting a strengthening trend. Sated: A red bar appears after an eating phase, suggesting the trend is ending. Trading Summary: The indicator is mostly used as a confirmation tool to avoid trading during consolidation.
0
newdigital Sergey Golubev 2026.03.03 17:29
MACD: entry points estimating XAGUSD Silver vs US Dollar
MACD: entry points estimating
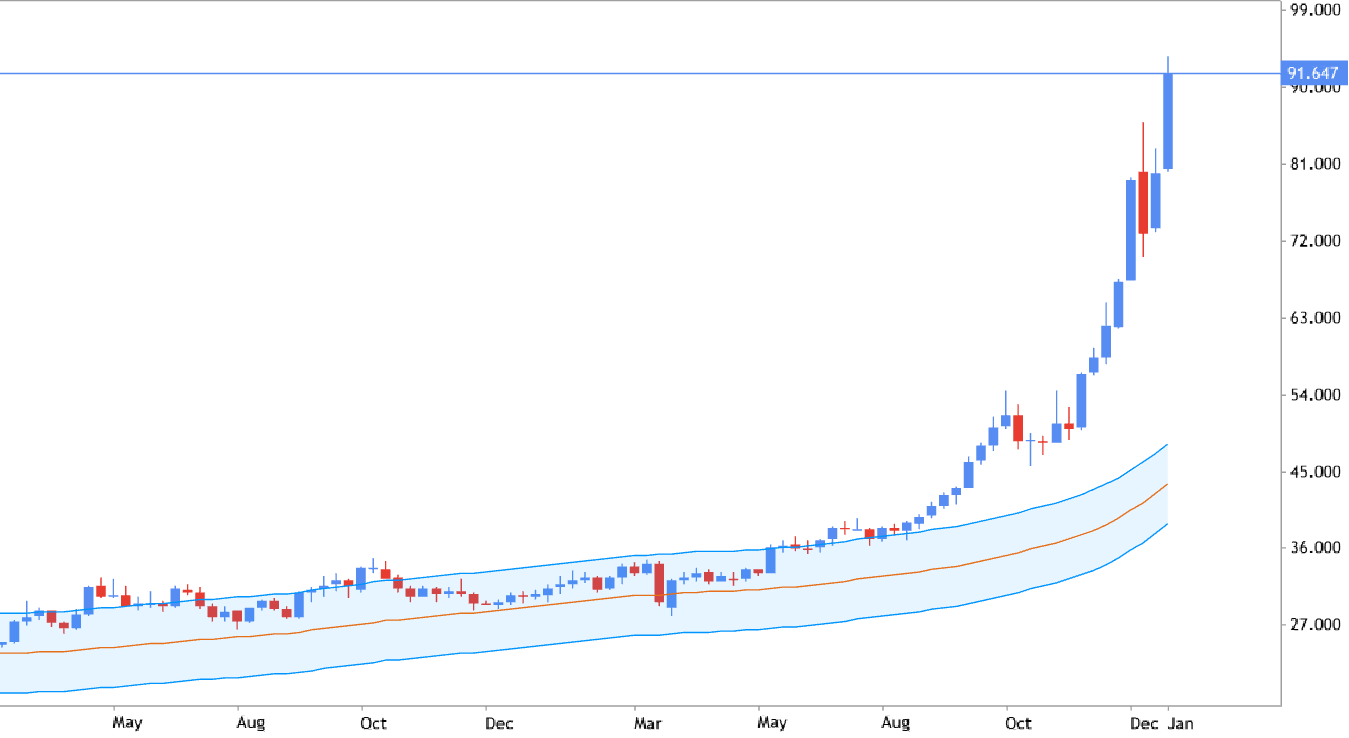
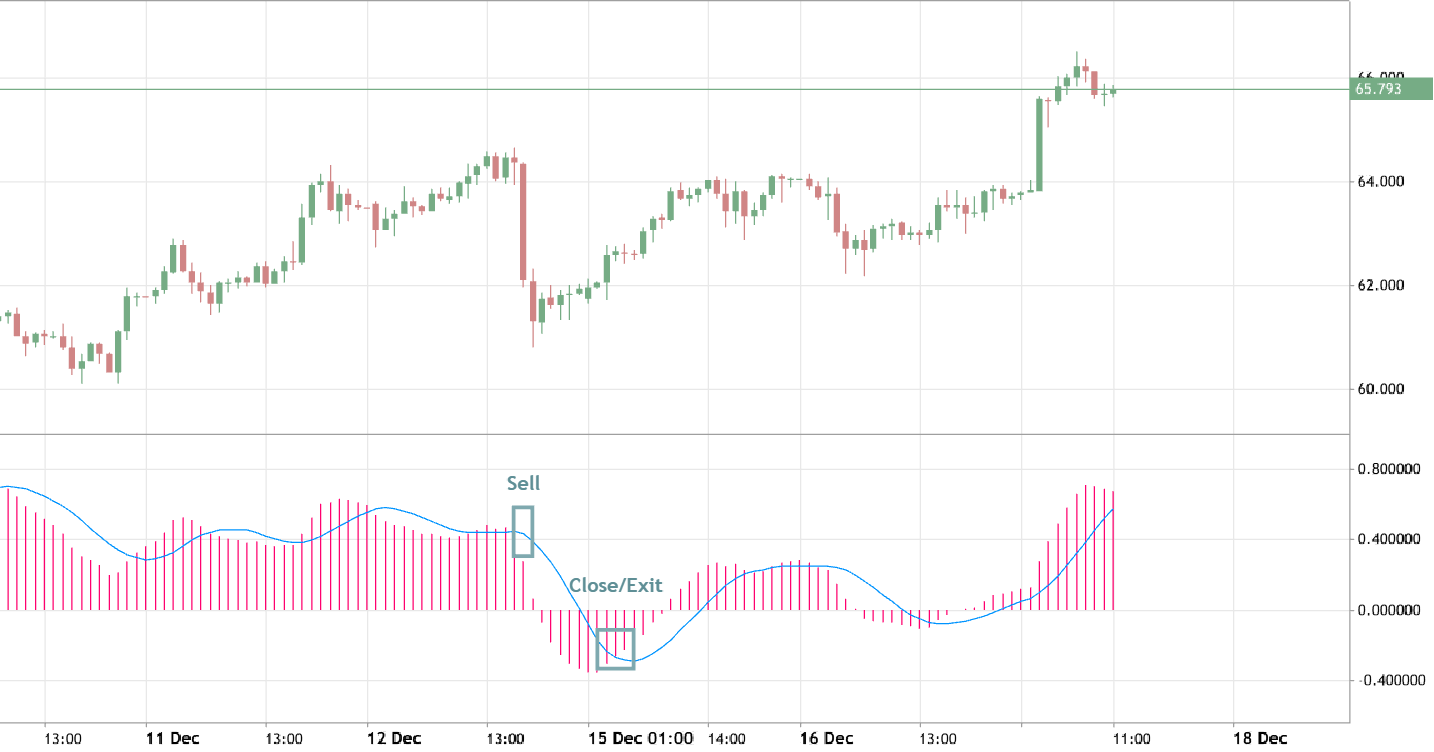
MACD is very universal indicator which can not used for trading because this indicator is estimating the entry points for buy and sell (on M5 or M15 timeframe). Besides, we may use this indicator for trade confirmation to determing about the following: will our trade go on the direction of the primary trend on H4 timeframe (for example) or not. Many traders are using MACD to estimate the primary direction in the beginning of the trading sesssion which help them a lot take some part of the primary trend onto the profit for example.
0
newdigital Sergey Golubev 2025.12.17 09:33