XAUUSD TRADE IDEA XAUUSD Short Gold vs US Dollar

XAUUSD TRADE IDEA

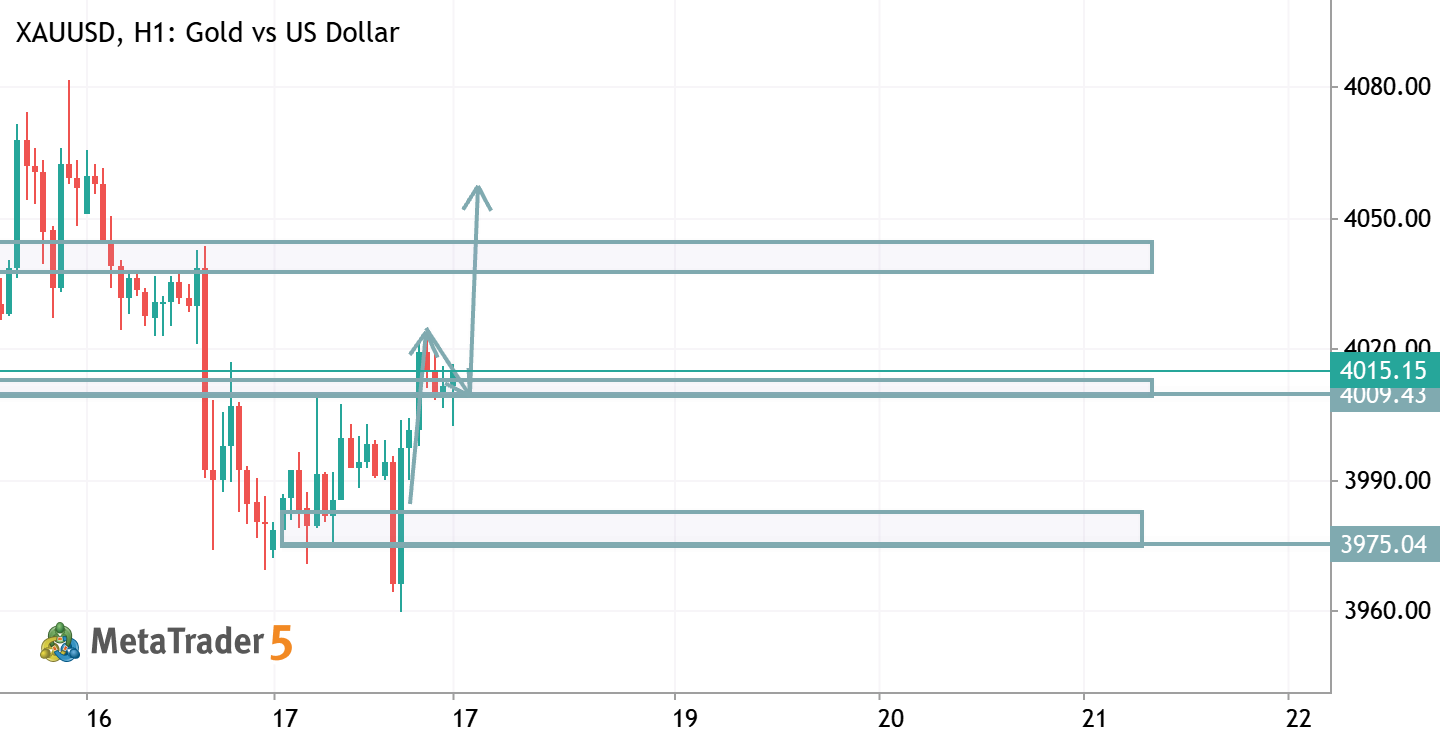
XAUUSD H1 Bias: Bearish in the short term Trend: Price remains inside a descending channel, with lower highs and lower lows. Resistance: 4078–4082 , then 4108–4112 (major supply zone). Support: 4045 , then 4016 (strong demand zone). Trade Idea (Sell): Entry: Sell on a pullback to 4078–4082 , or after a confirmed break below 4045 . Stop Loss: Above 4112 . Take Profit 1: 4045 Take Profit 2: 4016 Conclusion: The overall structure remains bearish. Unless price breaks and closes above 4112 , sellers maintain the advantage. A rejection from resistance or a breakdown below 4045 would strengthen the bearish continuation.

XAUUSD H1 ANALYSIS XAUUSD Gold vs US Dollar

XAUUSD H1 ANALYSIS

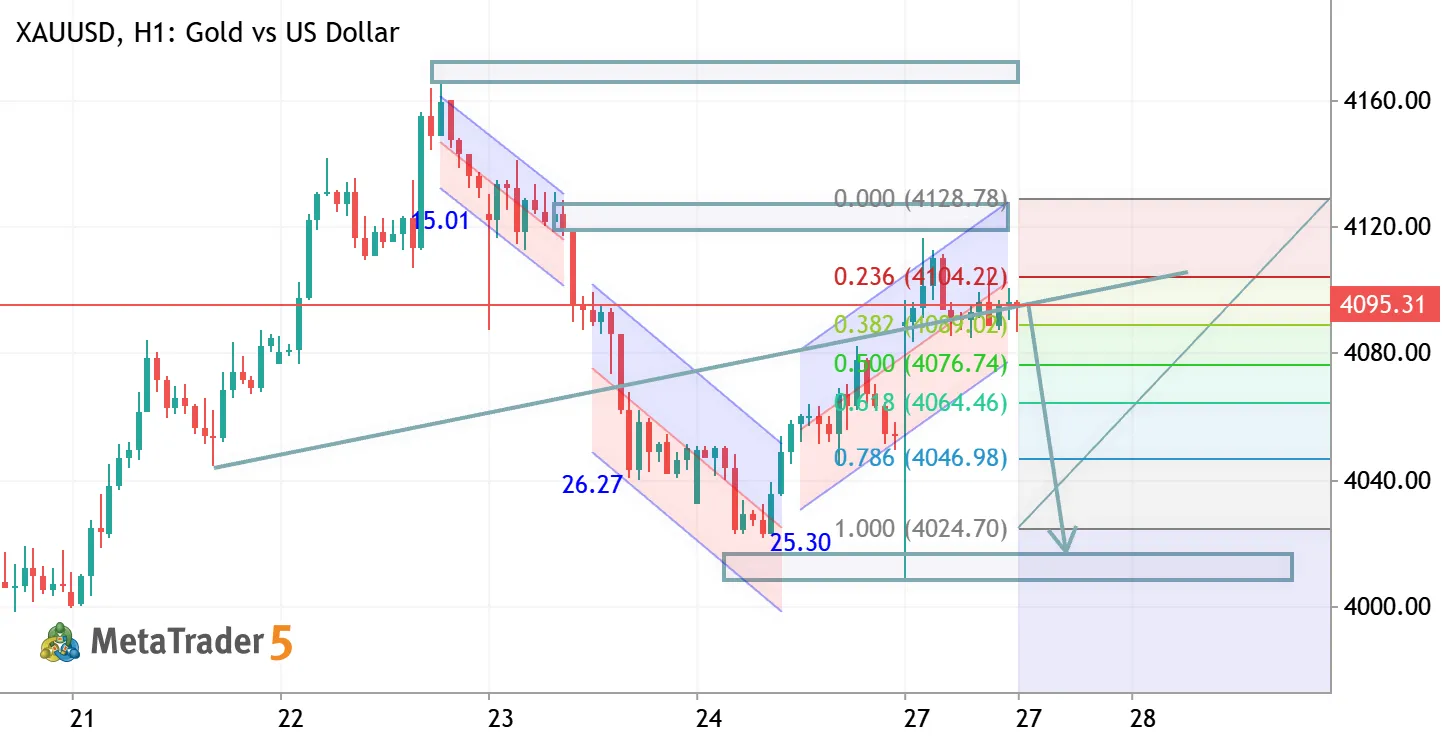
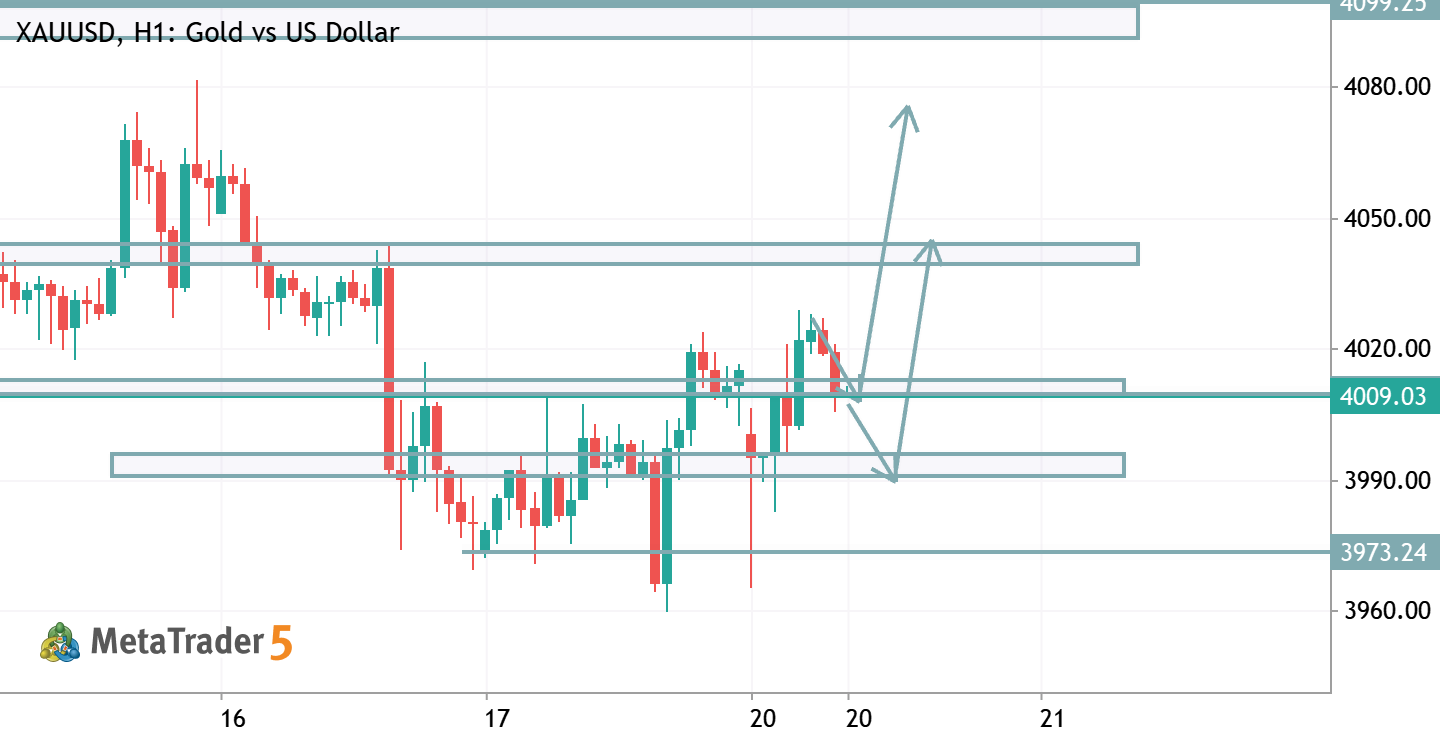
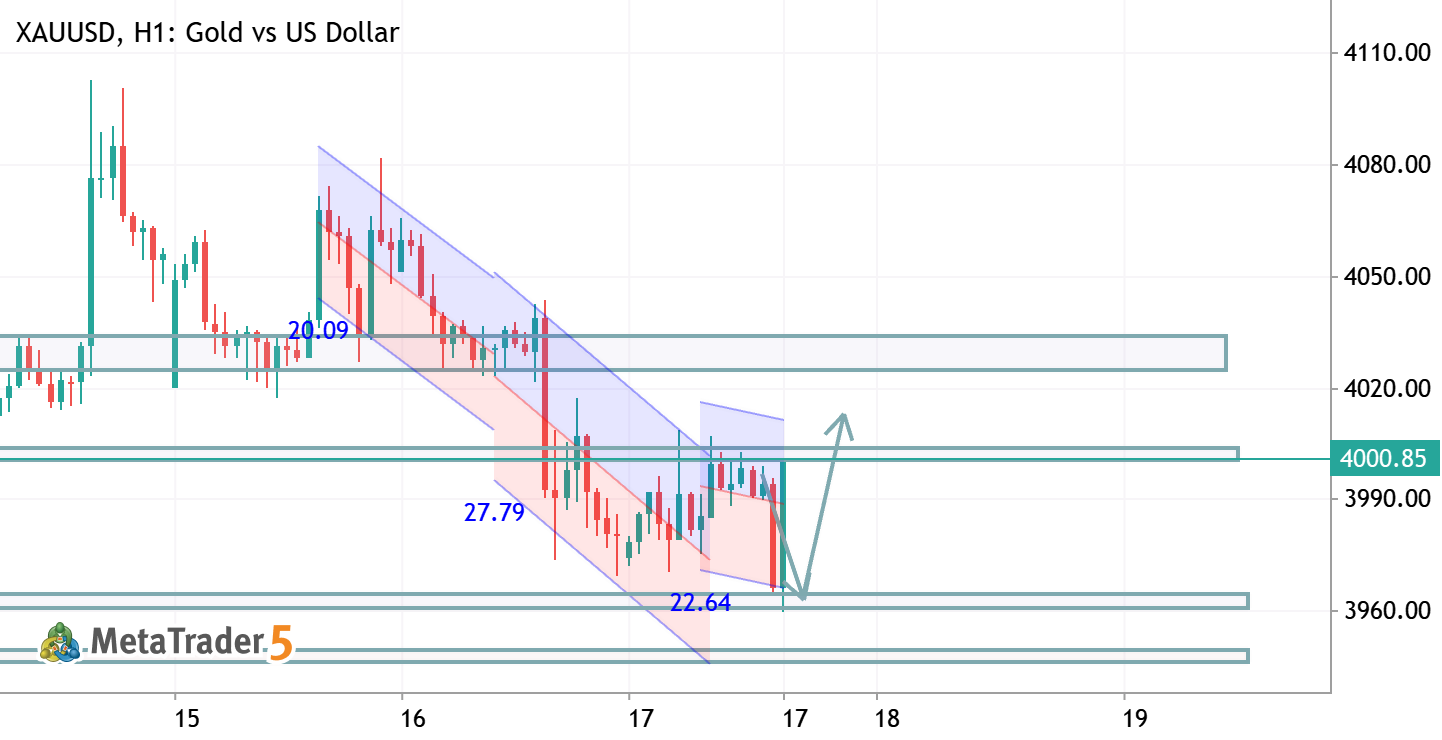
XAUUSD H1 Analysis Gold is attempting a bullish recovery after finding support near the recent swing low. Price is trading above key Fibonacci support, but buyers must clear the 4095–4130 resistance zone to confirm a trend reversal. A successful breakout could fuel further upside. 📈 Bias: Bullish Recovery 🎯 Targets: 4095 → 4130 ⚠️ Key Support: 4025–4000 Wait for a confirmed breakout or a pullback to support before entering. Always use proper risk management.
XAUUSD: Rising Channel Breakdown Potential Bearish Scenario XAUUSD Gold vs US Dollar

XAUUSD: Rising Channel Breakdown Potential Bearish Scenario

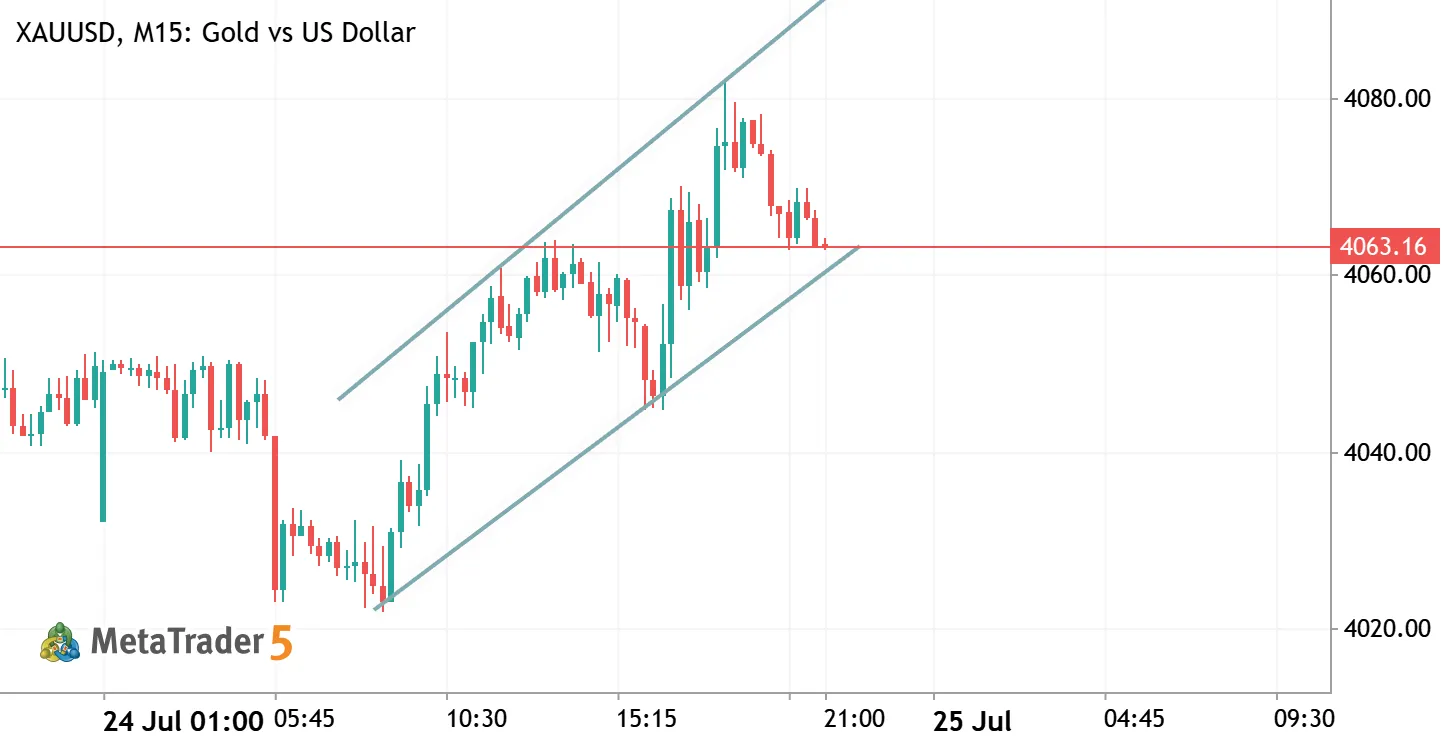
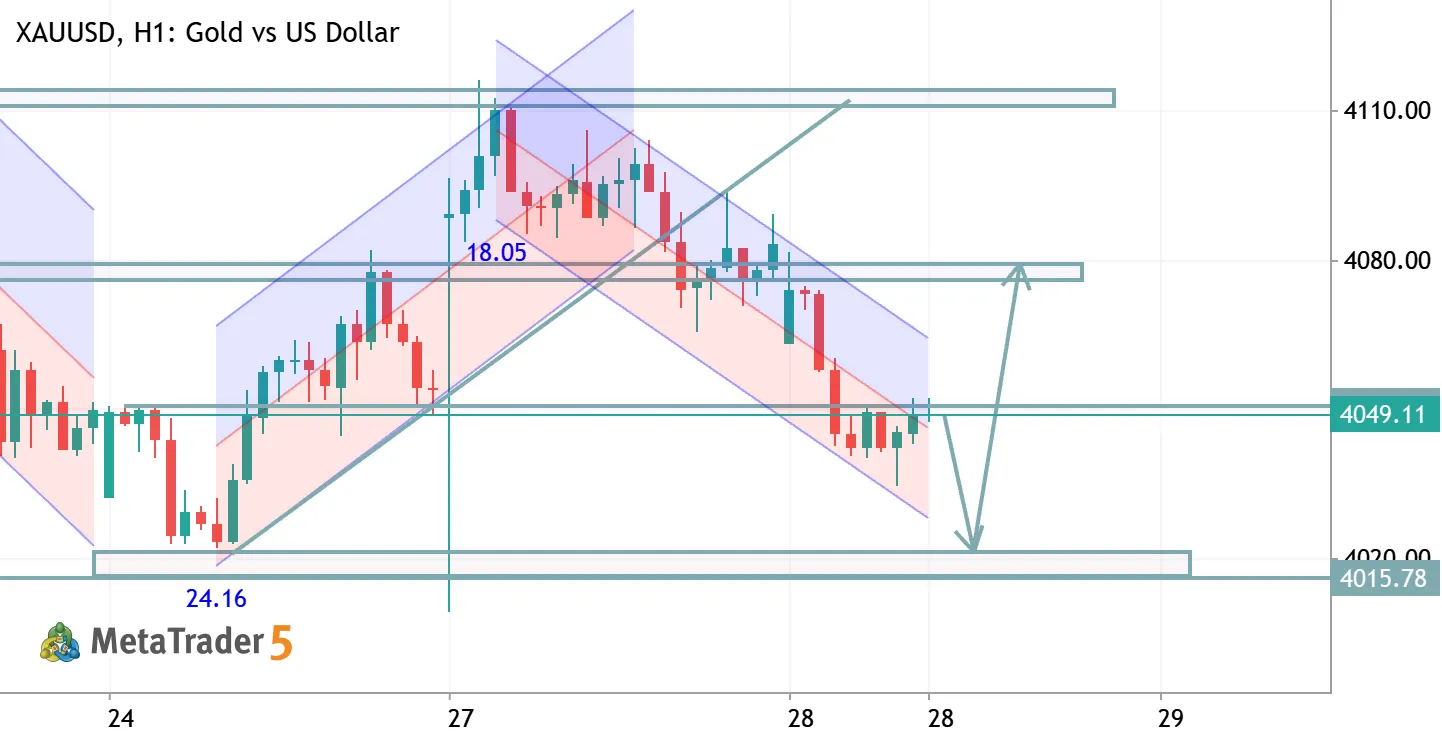
Gold is currently moving inside an ascending channel after a strong bearish move. However, this structure may represent a corrective pullback rather than a full reversal. I'm watching for a breakdown below the channel support. A confirmed break and rejection on the retest could indicate bearish continuation toward previous support areas. Key levels: 🔻 Channel support: Bearish breakout area 🔹 Support zones: 4050 / 4020 Waiting for price action confirmation before considering the next move.
XAUUSD H1 ANALYSIS XAUUSD Gold vs US Dollar

XAUUSD H1 ANALYSIS

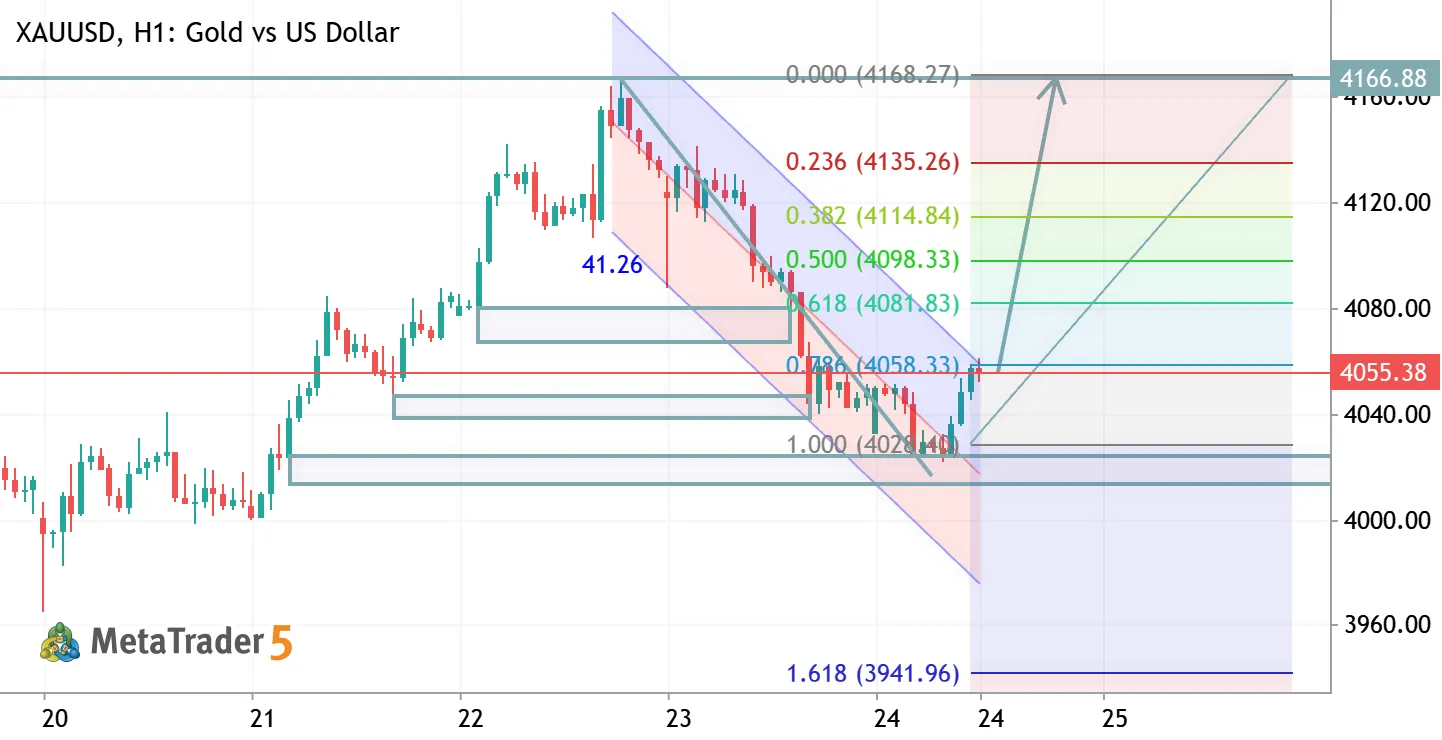
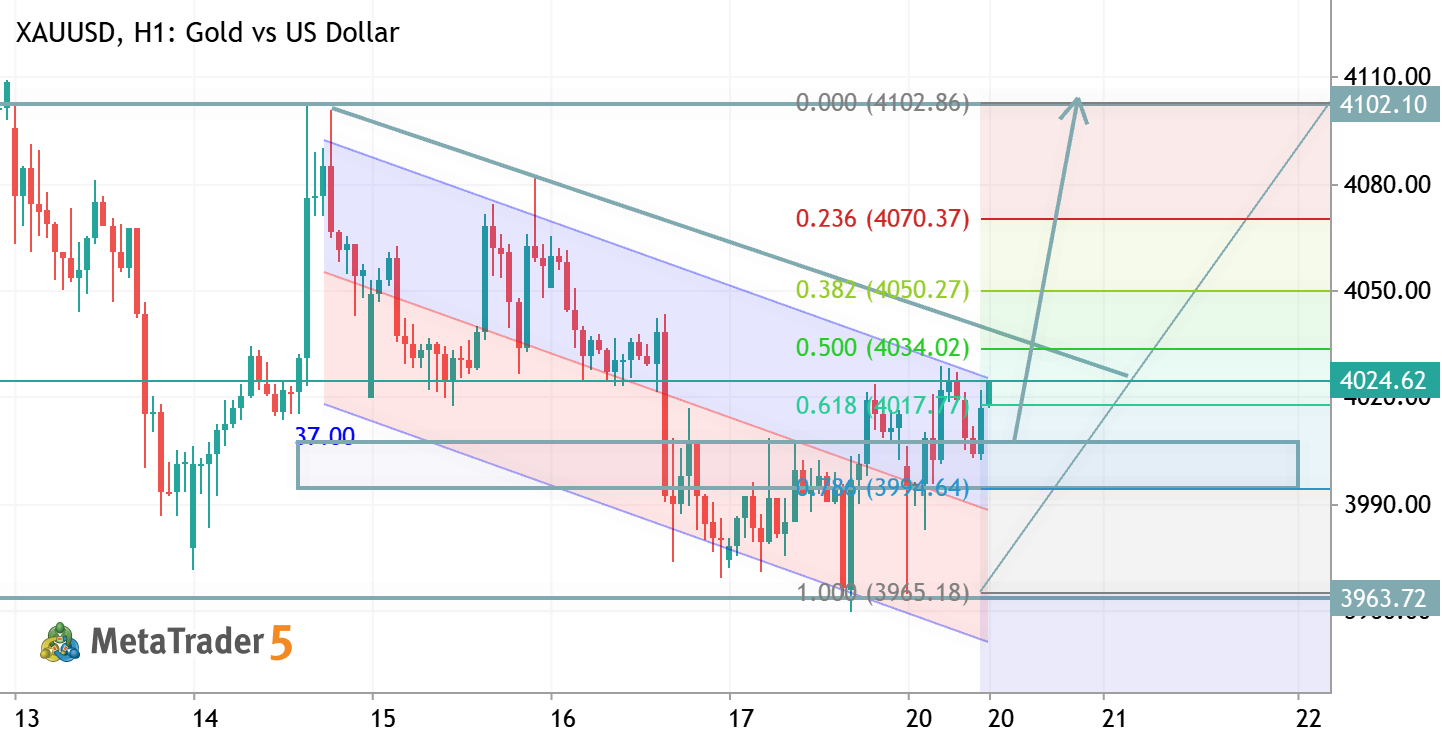
XAUUSD H1 Analysis Gold is showing signs of a bullish reversal after rejecting the descending channel support. Price has reclaimed key Fibonacci levels, and buyers are targeting the major resistance zone near 4165. A sustained move above resistance could accelerate the bullish momentum. 📈 Bias: Bullish 🎯 Targets: 4135 → 4165 ⚠️ Key Support: 4050–4020 The trend favors buyers while price holds above support. Wait for confirmation and apply proper risk management before entering.
XAUSSD TRADE IDEA XAUUSD Long Gold vs US Dollar

XAUSSD TRADE IDEA

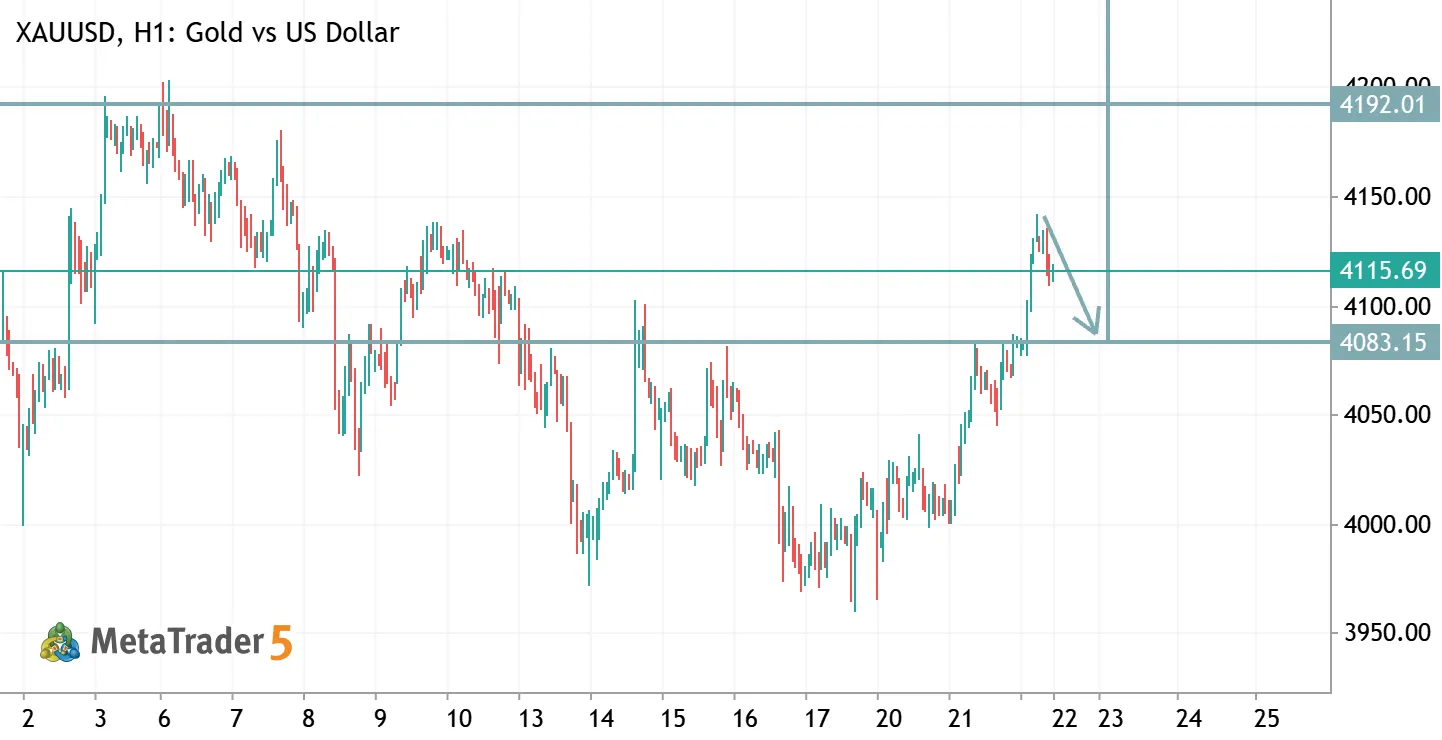
XAUUSD (H1) Bias: Bullish only if price holds above 4083 and breaks 4118 . Buy Entry: 4085–4095 on a bullish retest, or after an H1 candle closes above 4118 . Stop Loss: Below 4065 (or below the recent swing low). Take Profit 1: 4118 Take Profit 2: 4192 Take Profit 3: 4321 Confirmation: Wait for a bullish engulfing candle or a strong H1 close above 4118 before adding to long positions. Overall, the chart favors a buy continuation if 4083 remains support and 4118 is broken with momentum.
XAUUSD H4 ANALYSIS XAUUSD Gold vs US Dollar

XAUUSD H4 ANALYSIS

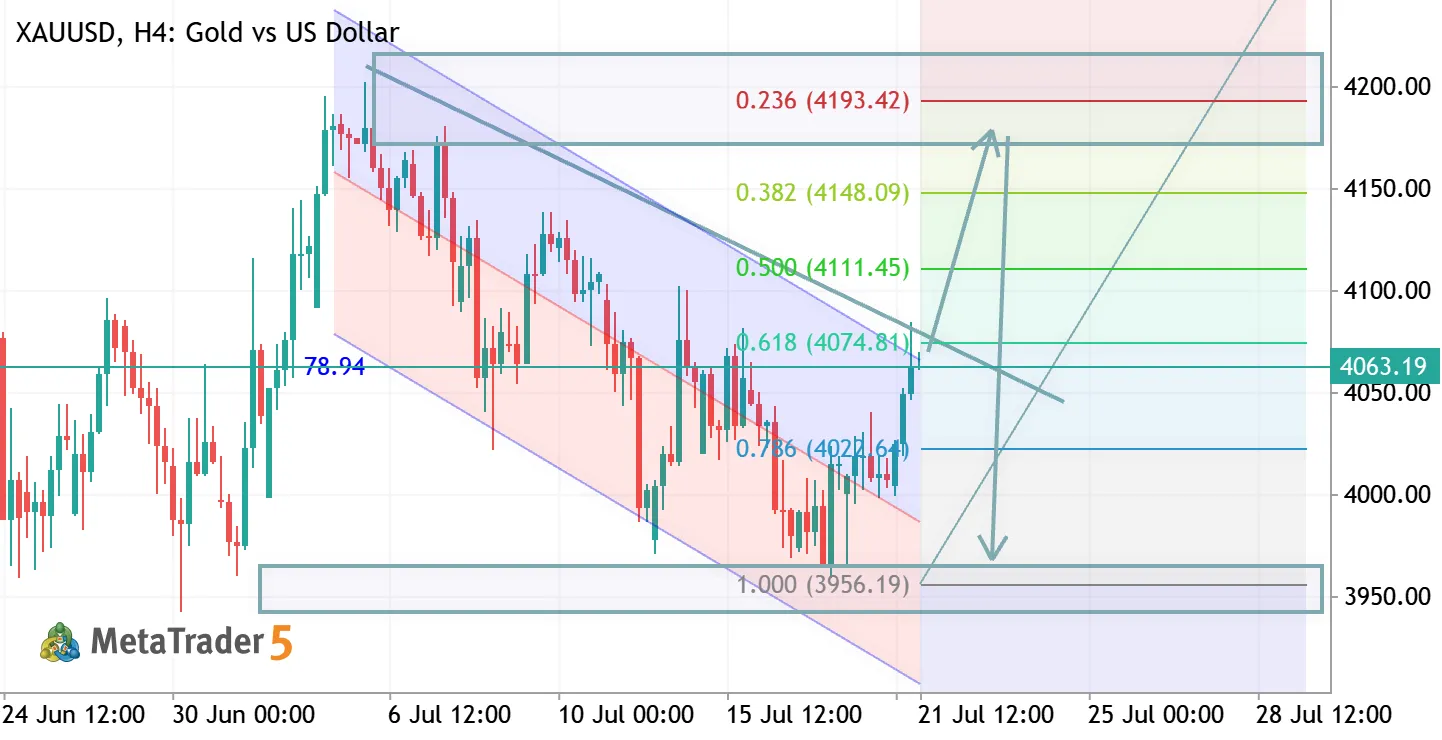
XAUUSD H4 Analysis Gold is trading inside a rising channel after a strong recovery, with price approaching a key Fibonacci resistance zone. A clean breakout above 4195–4270 could confirm bullish continuation, while rejection may trigger a healthy pullback toward support before the next leg higher 📈 Bias: Bullish 🎯 Targets: 4195 → 4270 ⚠️ Key Support: 4025–4000 Stay patient for confirmation at resistance and always apply proper risk management.
XAUUSD H1 ANALYSIS XAUUSD Gold vs US Dollar

XAUUSD H1 ANALYSIS

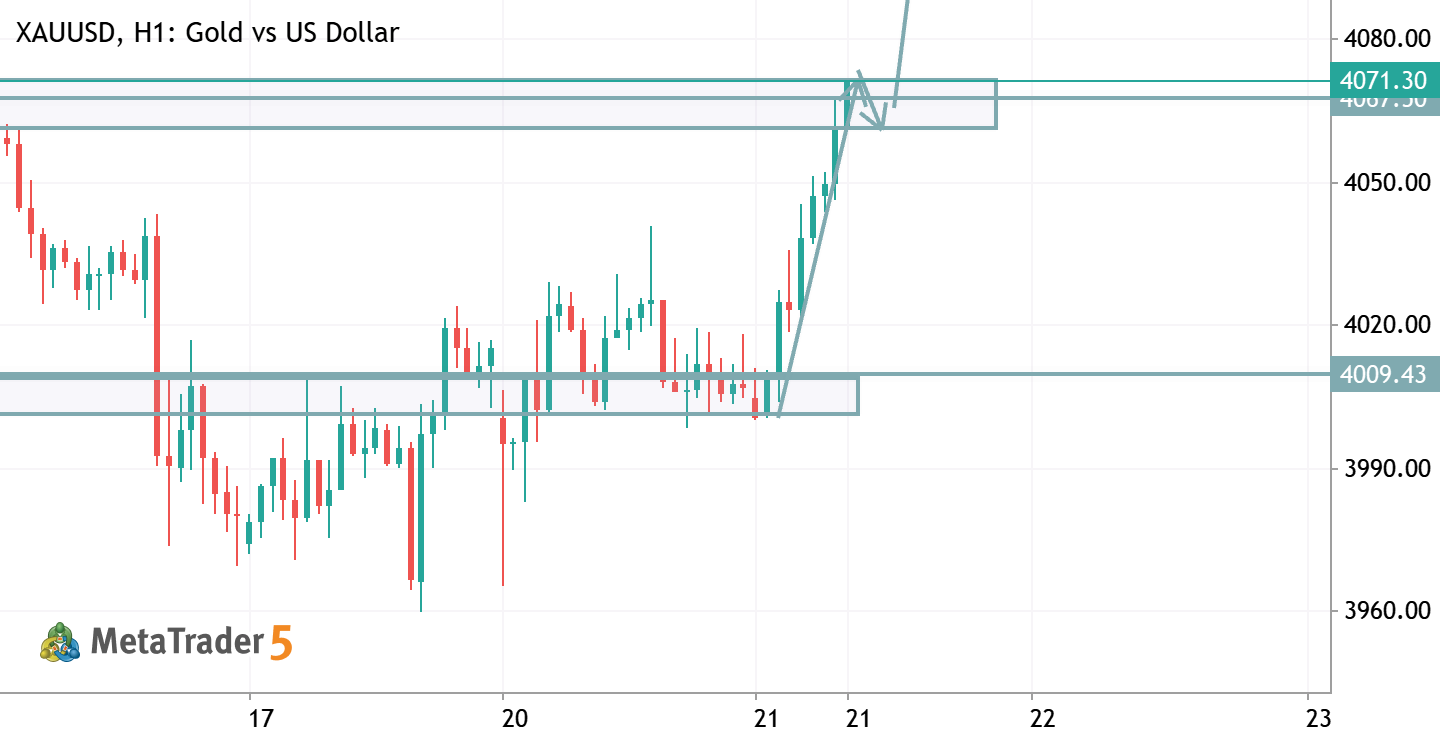
XAUUSD H1 Analysis Gold is trading within a bullish recovery structure after holding above key support. Price is approaching a major resistance zone near 4100, where a breakout could trigger the next impulsive move. A successful close above resistance would strengthen the bullish outlook. 📈 Bias: Bullish 🎯 Targets: 4100 → 4120 ⚠️ Key Support: 4000–3965 Wait for breakout confirmation or a healthy pullback before entering. Always use proper risk management.
XAUUSD H4 ANALYSIS XAUUSD Gold vs US Dollar

XAUUSD H4 ANALYSIS

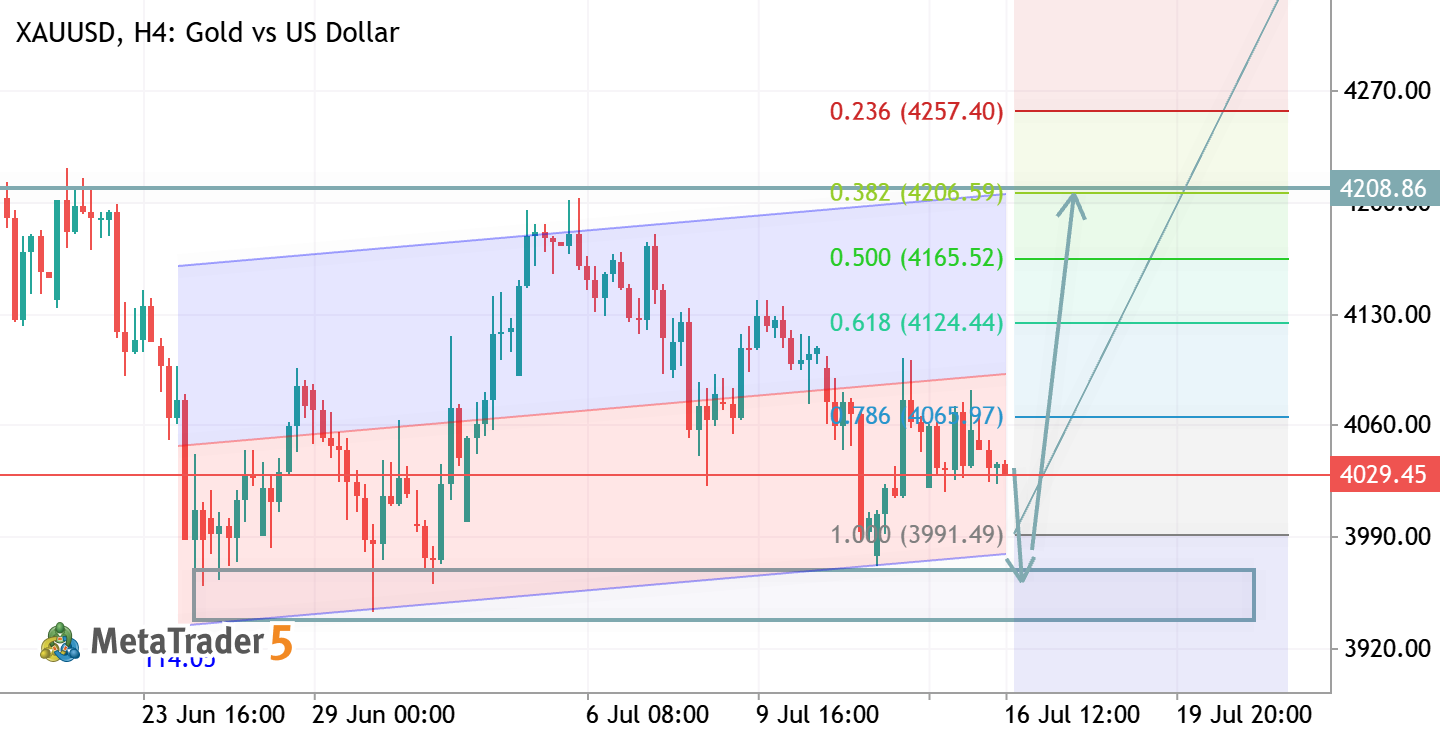
XAUUSD – H4 Analysis XAUUSD is holding above a key support zone after completing a Fibonacci retracement near the 0.786–1.000 area, suggesting buyers are defending the trend. A sustained move above the 0.382–0.236 retracement zone could trigger bullish continuation toward the major resistance around 4350–4400. However, losing the recent swing low would invalidate the bullish outlook and increase downside risk. Bias: Bullish above support. Key Levels: Support: 3990–4060 | Resistance: 4257 → 4358.