XAUUSD Under Pressure: U.S. Inflation Increases Risks for Gold XAUUSD Gold vs US Dollar

XAUUSD Under Pressure: U.S. Inflation Increases Risks for Gold

XAUUSD Under Pressure: U.S. Inflation Increases Risks for Gold Gold has come under renewed pressure after another failed attempt to extend its recovery. The main fundamental factor was the latest U.S. inflation data, which came in above market expectations. At first glance, higher inflation should support gold as a traditional safe-haven and inflation hedge. However, for XAUUSD, not only inflation itself matters, but also how the Federal Reserve reacts to it. If inflation remains elevated, the Fed has additional reasons to maintain a restrictive monetary policy stance. This can support U.S. Treasury yields and the U.S. dollar, reducing the relative attractiveness of gold as a non-yielding asset. XAUUSD Technical Analysis After recovering from levels below $4,000 , buyers attempted to

Gold Daily Plan | Nov 10, 2026 XAUUSD Gold vs US Dollar

Gold Daily Plan | Nov 10, 2026

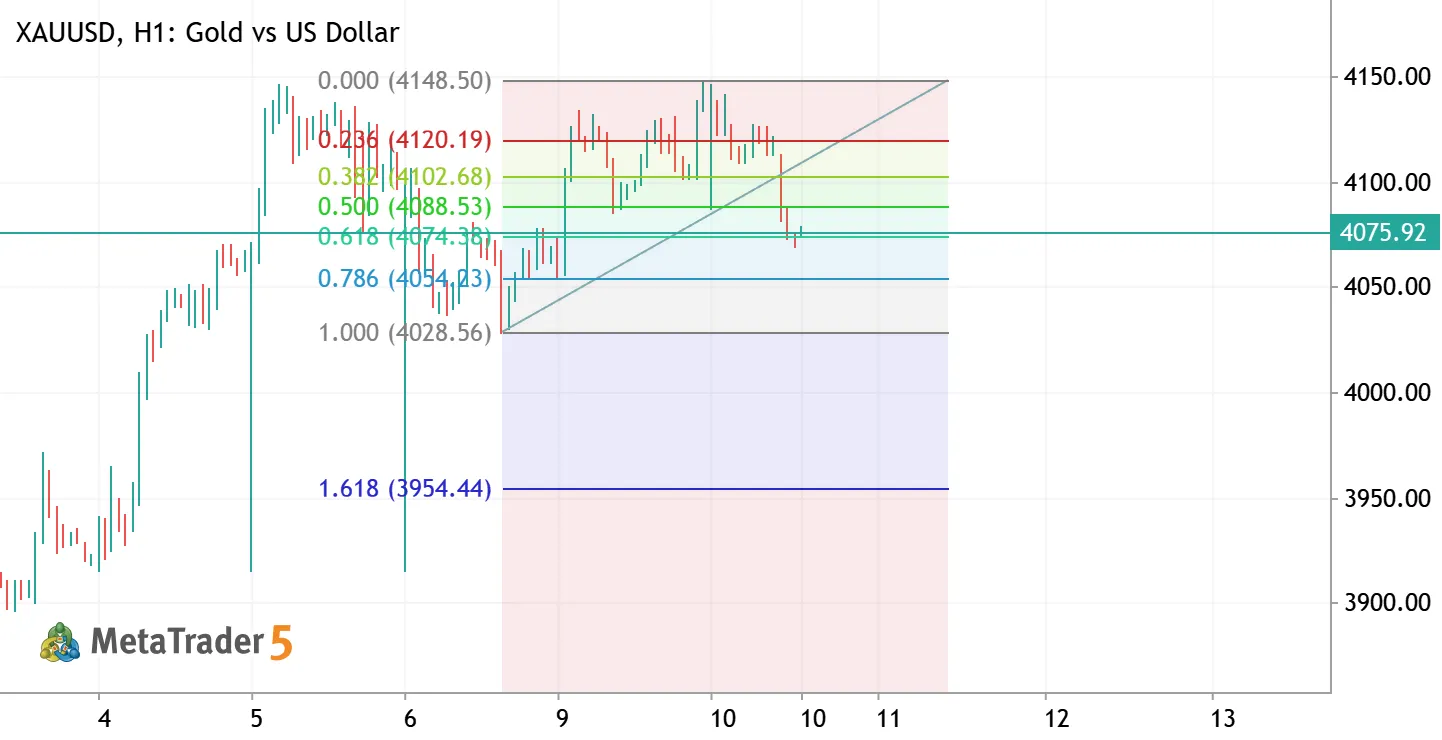
Sitting on the 0.618 ahead of US CPI** **H1 view:** Gold failed again at the 4148 high and printed a lower high near 4128. Price then broke the rising trendline and is now sitting right on the **0.618 Fibonacci (4074.71)**. The bias has turned slightly bearish, but the next move will be decided by today's CPI. Fibonacci of the last bullish leg (4028.51 → 4148.15): - 0.236 → 4119.92 - 0.382 → 4102.45 - 0.500 → 4088.33 - 0.618 → 4074.71 - 0.786 → 4054.11 **Main event – US CPI (13:30 GMT):** - Headline forecast: 0.3% m/m and 3.9% y/y (previous 0.6% / 3.7%) - Core forecast: 0.2% m/m and 2.8% y/y A hot number boosts Fed hike bets and pressures gold. A soft number gives gold room to bounce. **No entries before the release.** **Plan A – SELL (hot CPI):** - Trigger: H1 close below 4054 (0.786) -
XAUUSD M15: Buy from 4,110–4,118 Support, Targets 4,135 / 4,145 XAUUSD Long Gold vs US Dollar

XAUUSD M15: Buy from 4,110–4,118 Support, Targets 4,135 / 4,145

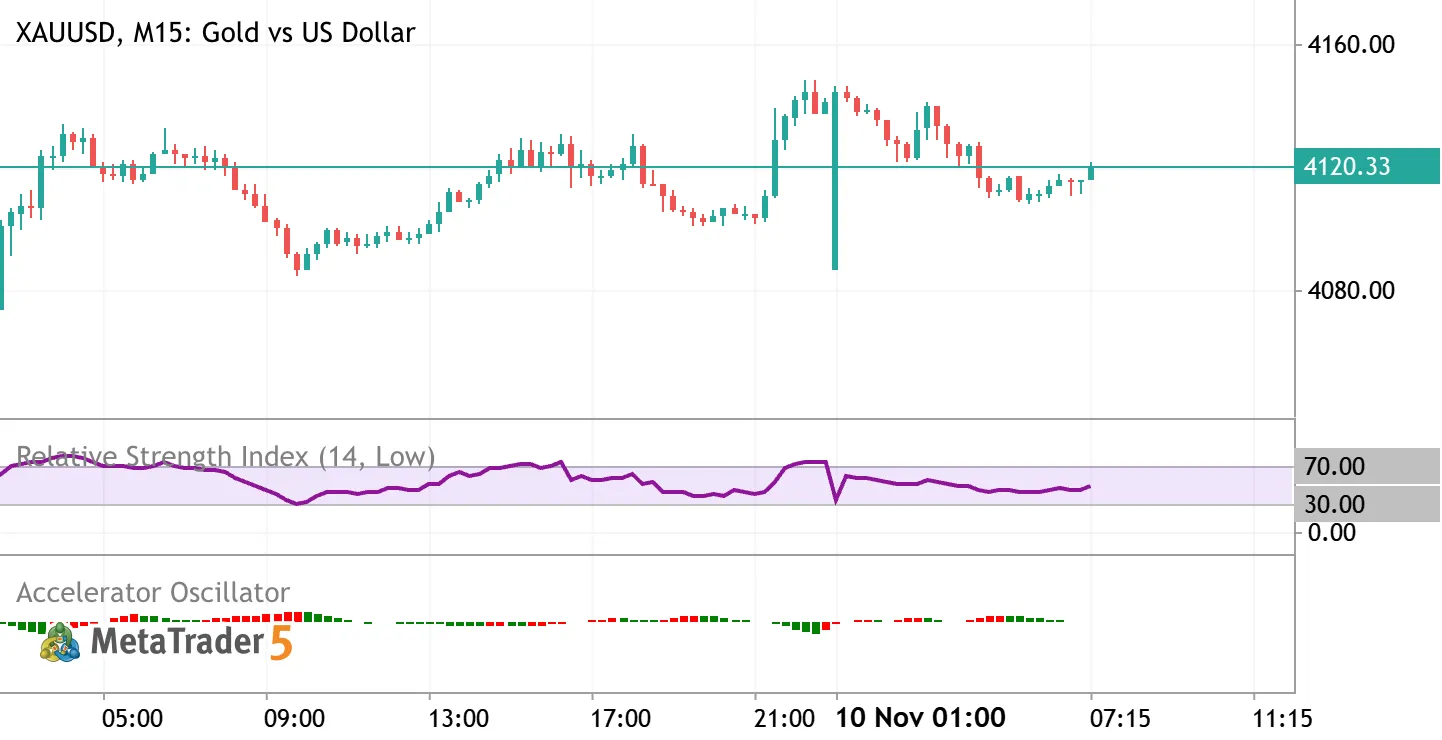
Gold has been trading in a 4,100–4,150 range since Monday's rally. Highs are getting lower (4,149, then 4,142), but buyers keep defending the lower half of the range. Over the last 2 hours, price has built a small base at 4,108–4,120 with slightly higher lows. RSI (14) is back near 50 and rising, and the Accelerator Oscillator has printed its first green bar after a run of red, so selling pressure is easing. Trade setup (Long): Entry: 4,113–4,118 Stop loss: 4,098 (below the 4,100 range floor) Take profit 1: 4,135 Take profit 2: 4,145 After TP1, move the stop to entry. Invalidation: an M15 close below 4,105. In that case, the alternative is a sell on a retest of 4,105–4,110, with a stop at 4,122 and targets at 4,090 and 4,085. Validity: until 12:00 UTC, 10 Nov 2026. The London open can
#XAUUSD: A Bear Trap at $4,000? XAUUSD Gold vs US Dollar

#XAUUSD: A Bear Trap at $4,000?

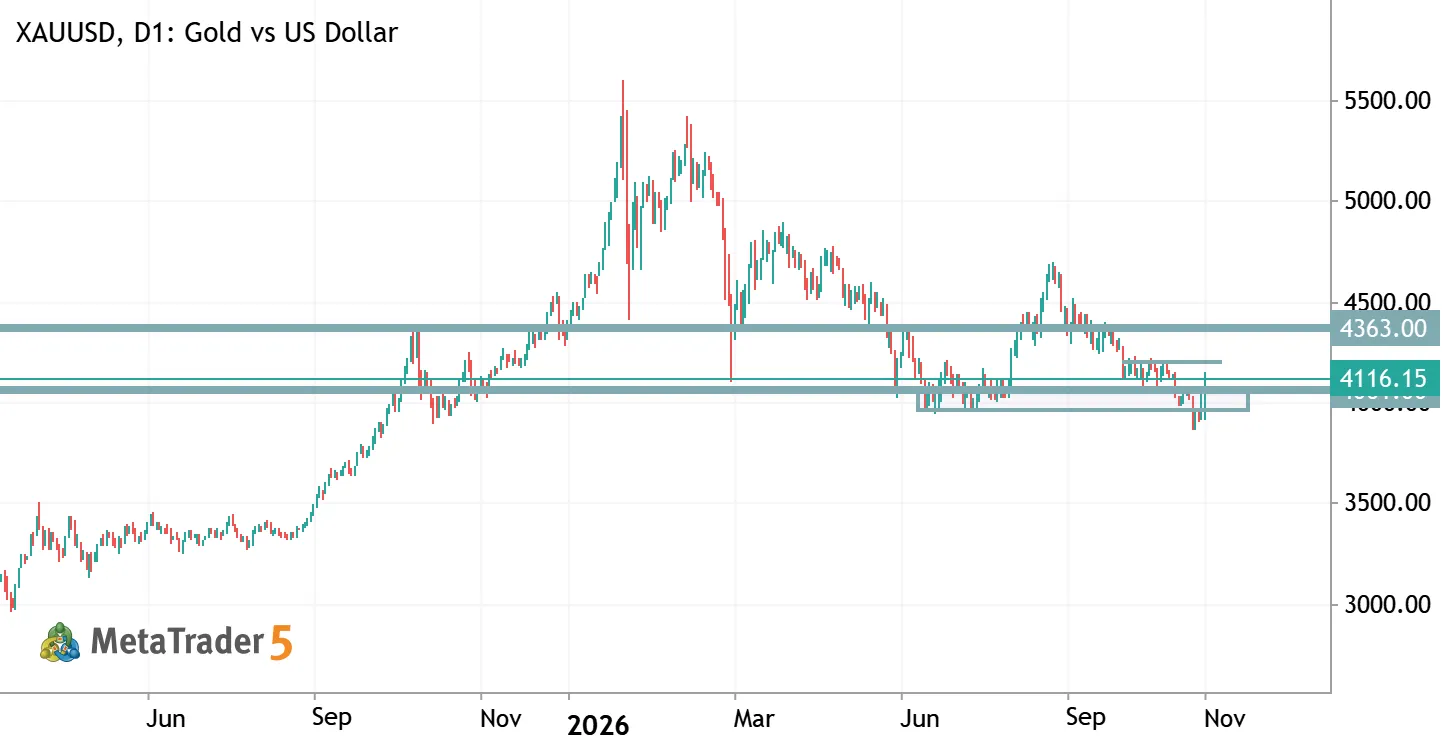
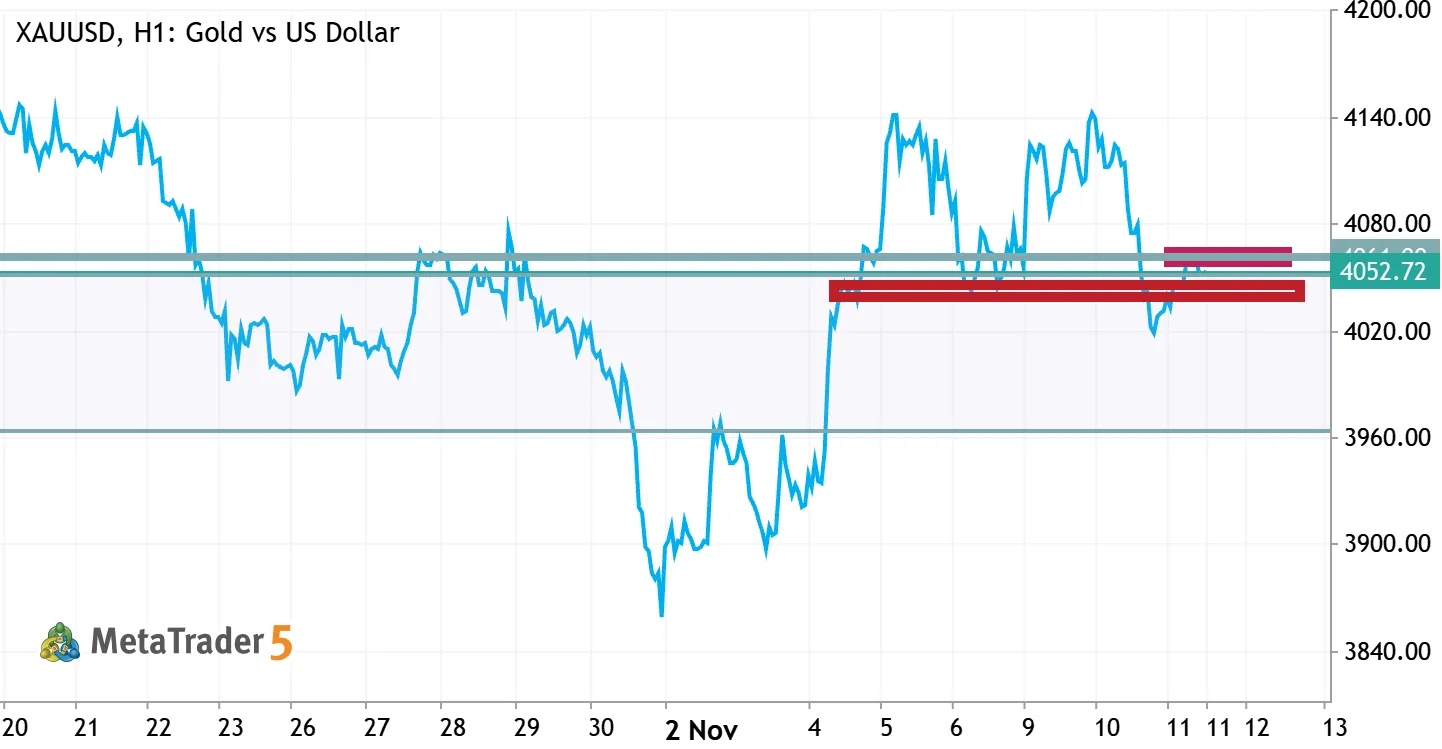
Gold has staged a sharp reversal after falling below the psychologically important $4,000 level . Fundamental support came from the U.S. midterm election results, where Democrats strengthened their political position. A weaker U.S. dollar, declining Treasury yields, and easing inflation concerns amid falling oil prices created favorable conditions for a recovery in XAUUSD. Technically, the situation resembles a classic bear trap. Following the breakdown below support, sellers failed to extend the decline. The price quickly recovered above $4,000, potentially triggering short covering and adding momentum to the rally. Key Levels: $4,150–4,180 — the highest-volume trading area over the past year and immediate resistance. $4,000–4,040 — an important support zone. $3,900 — the area of recent
Gold Price Forecast 2026: Will XAUUSD Hold Above $4,000 or Fall to $3,500? XAUUSD Gold vs US Dollar

Gold Price Forecast 2026: Will XAUUSD Hold Above $4,000 or Fall to $3,500?

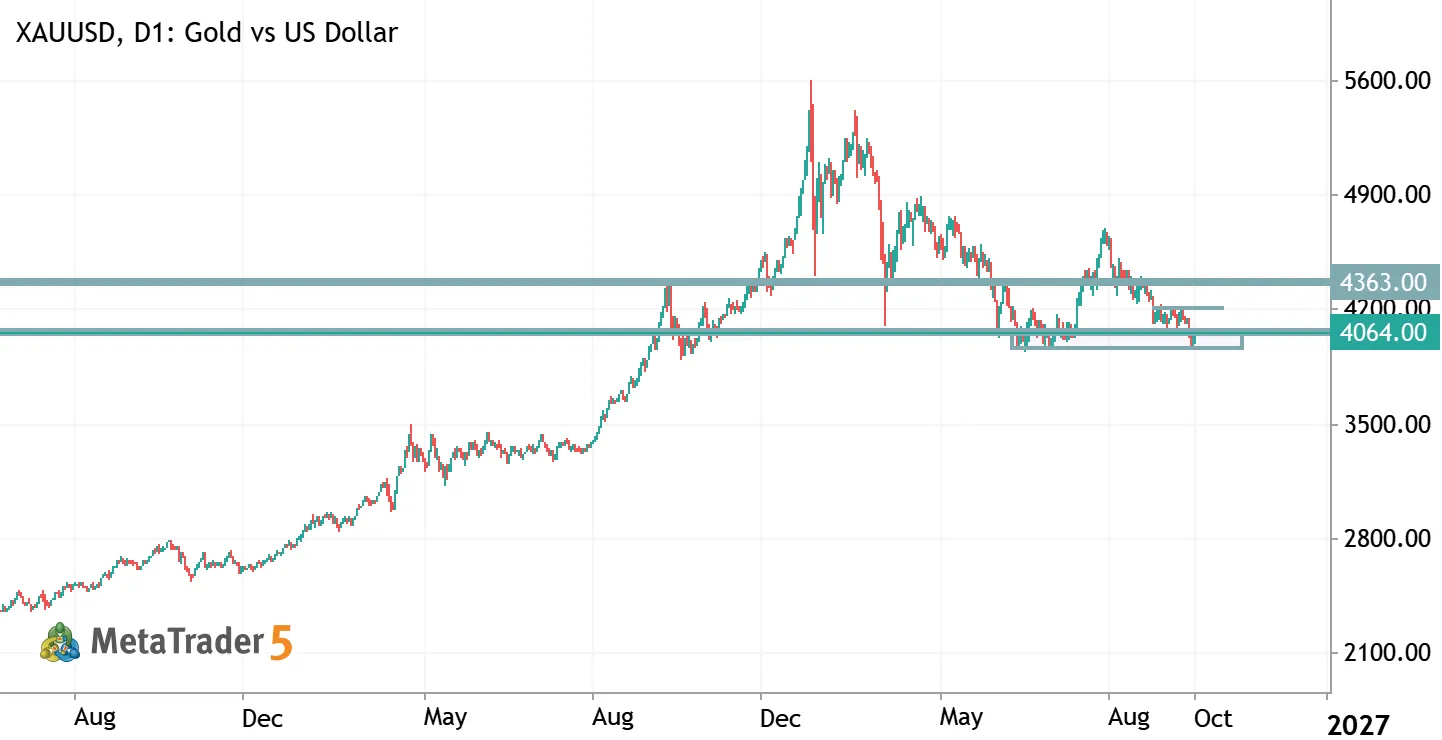
Gold is once again approaching a critical technical level. Following a substantial correction, XAUUSD is testing the psychological $4,000 mark, which coincides with the highest-volume price area of the past year. Can gold resume its bullish trend? How do high Federal Reserve interest rates, inflation, and rising oil prices affect the precious metal? Let's examine the technical outlook and three probability-based scenarios for the next 3–6 months. XAUUSD Technical Analysis: Why Is $4,000 So Important? The daily gold chart shows a sequence of lower highs, indicating weakening buying pressure. Bulls have yet to restore the previous upward momentum. The key battle is now taking place around $4,000 — both a major psychological level and the highest-volume area over the past year. Holding this
XAUUSD (Gold vs US Dollar), M15 (15-Minute) XAUUSD Long Gold vs US Dollar

XAUUSD (Gold vs US Dollar), M15 (15-Minute)

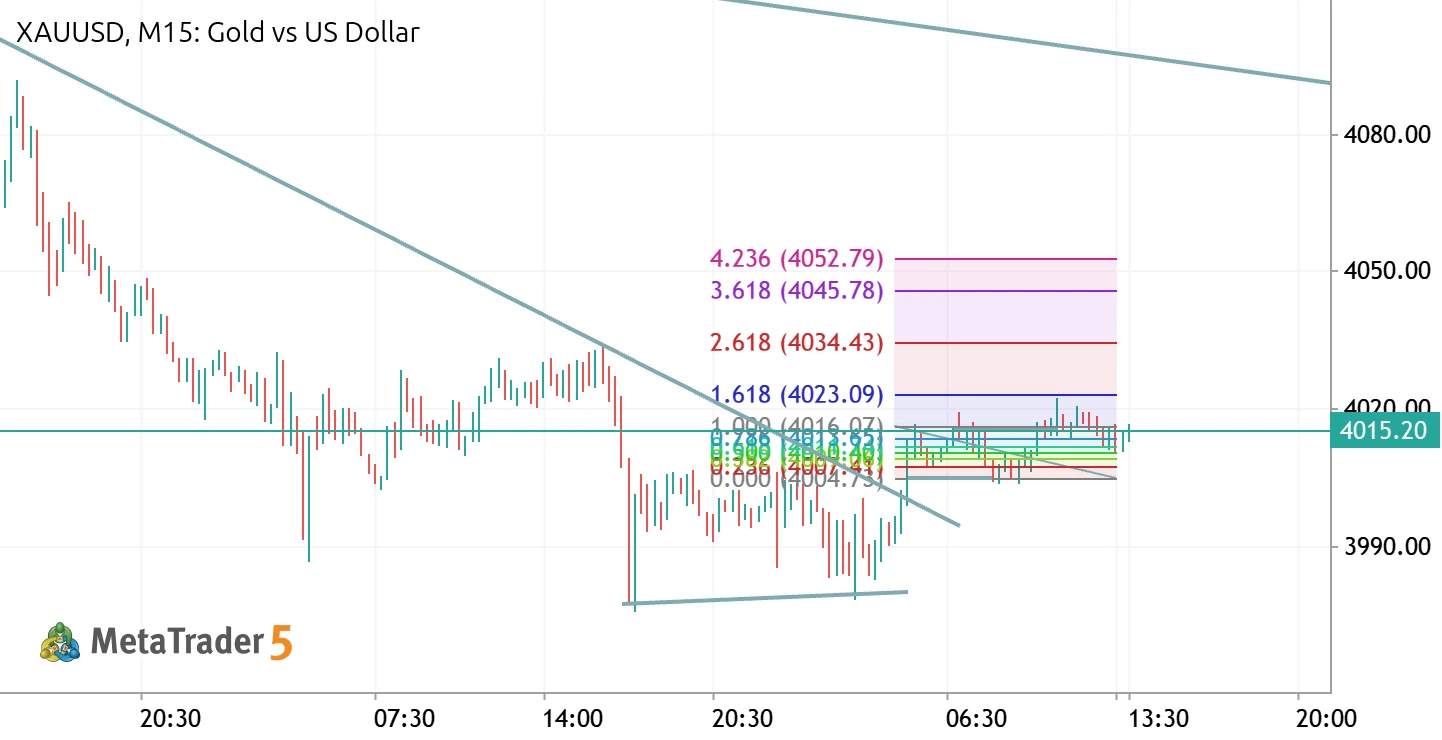
Price Structure & Trend Analysis: Major Trend: Overall, the price movement is still within a downtrend, indicated by the primary descending trendline (the upper diagonal line) acting as dynamic resistance. Short-Term Momentum: At the lower area, the price formed a consolidation pattern and has just broken out of the minor descending trendline. This breakout provides an early signal of a potential upward correction or short-term reversal. Key Levels & Fibonacci Areas: Critical Resistance Area: Currently, the price (at 4015.13) is testing a highly crucial resistance area. This zone is a confluence between the horizontal support/resistance line and the 1.000 Fibonacci level at 4015.67. Upside Projection Targets: Based on the Fibonacci drawing on the chart, if the price successfully
Gold Daily Plan | Oct 21, 2026 XAUUSD Gold vs US Dollar

Gold Daily Plan | Oct 21, 2026

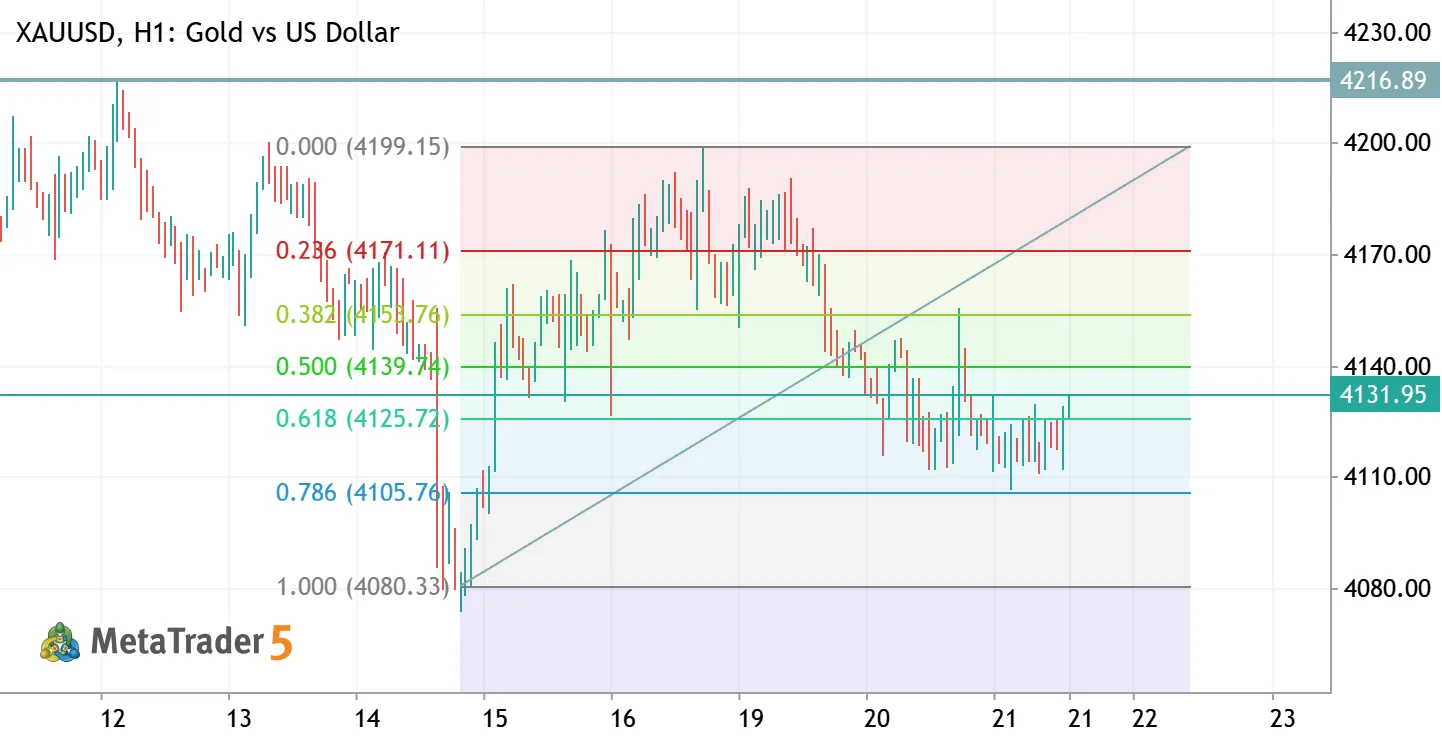
Gold Daily Plan | Oct 21, 2026 – Base at 4105–4113, reclaiming the 0.618 H1 view: Since the 4199 high, gold has been printing lower highs and broke its rising trendline on Oct 19. But sellers keep failing at the **4105–4113 support**, which has held for two days and is building a base. Price is now pushing back above the **0.618 Fibonacci (4125.79)**. Fibonacci of the last bullish leg (4080.41 → 4199.21): - 0.382 → 4153.83 - 0.500 → 4139.81 - 0.618 → 4125.79 - 0.786 → 4105.84 Fundamentals: - Talks over the Strait of Hormuz pulled Brent back from above $110, which eases inflation fears a little. - The headwind: US 10-year yields are above 5.1%, and markets are pricing a Fed hike in December. That keeps rallies limited. - The Fed decision is next week. Today: US crude inventories and the
XAUUSD – Gold Price Outlook | Potential Bearish Continuation XAUUSD Short Gold vs US Dollar

XAUUSD – Gold Price Outlook | Potential Bearish Continuation

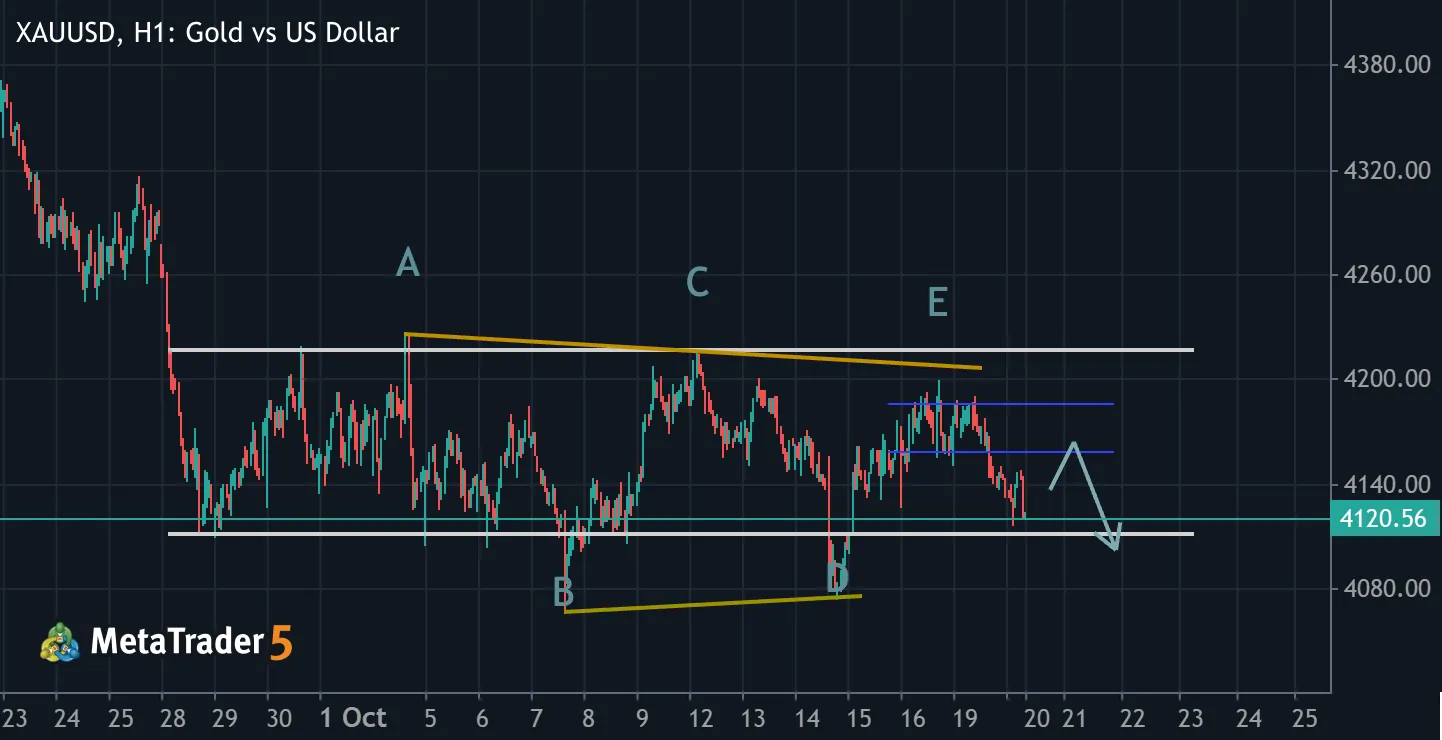
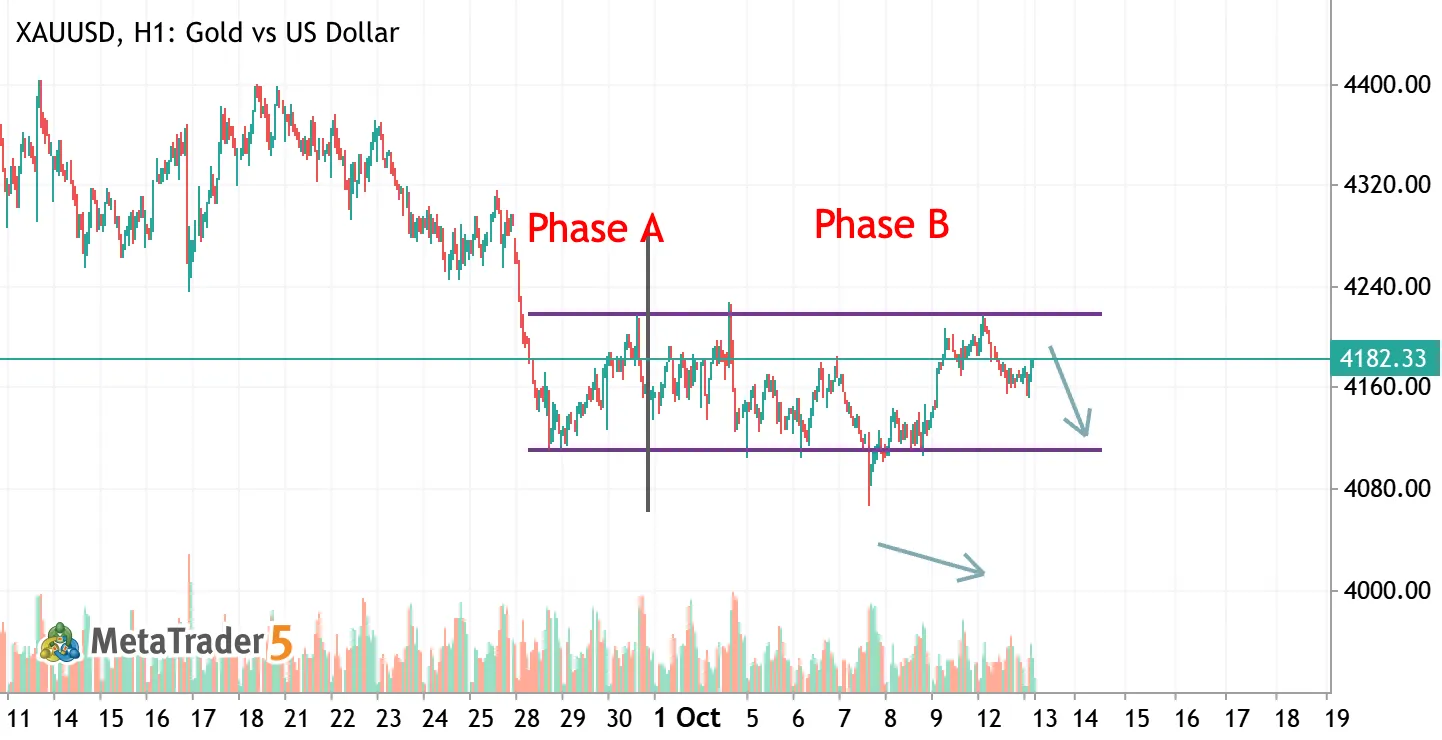
Price action may have completed a triangle wave formation within a larger bearish market structure. A smaller-scale distribution phase around the 4200 level appears to have been completed. Price may revisit the 4160 level to form a Backup (BU) event , potentially setting the stage for a larger bearish move. Disclaimer: This analysis reflects my personal market perspective and is provided for informational purposes only. It does not constitute financial or investment advice.
Gold Scalp M5 | Oct 16, 2026 XAUUSD Gold vs US Dollar

Gold Scalp M5 | Oct 16, 2026

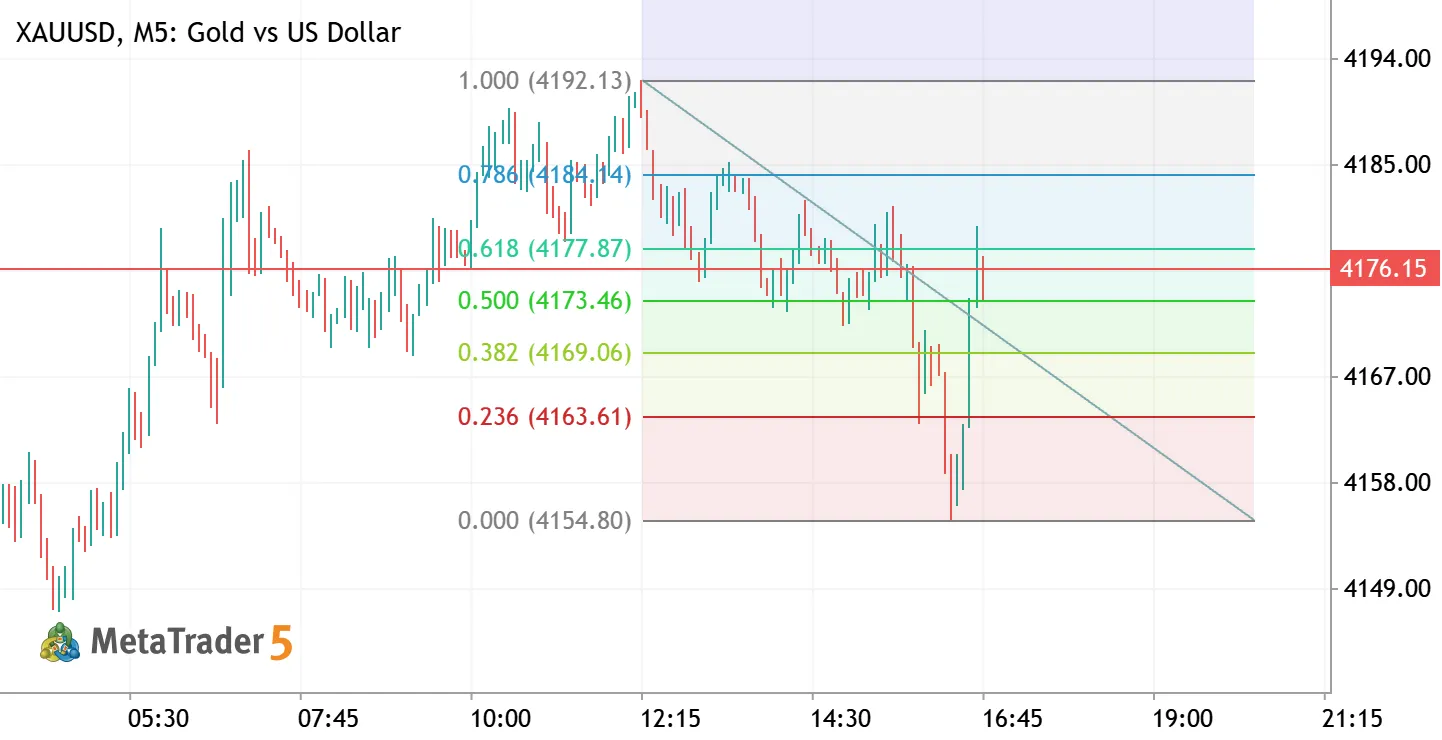
**Gold Scalp M5 | Oct 16, 2026 – V-reversal from 4155, buy the 0.500 pullback** Gold dropped from 4192 to 4154.80 and then reversed hard in a sharp V, breaking the descending trendline on the way up. Price tagged 4180 (just above the 0.618) and is now pulling back. Fibonacci of the drop (4192.14 → 4154.80): - 0.382 → 4169.06 - 0.500 → 4173.47 - 0.618 → 4177.87 - 0.786 → 4184.15 The **0.500 level (4173.5)** lines up with the bottom of the 4173–4184 range from earlier in the session, which makes it a strong support area for a quick long. **Trade: BUY LIMIT XAUUSD (M5 scalp)** - Entry: 4173.5 - SL: 4166 - TP1: 4184 - TP2: 4192 **Invalidation:** an M5 close below 4169 (0.382) means the V-reversal has failed, and 4155 comes back into play. Friday afternoon liquidity is thinner, so if the order
XAUUSD H1 | Range Resistance & Bearish Scenario XAUUSD Short Gold vs US Dollar

XAUUSD H1 | Range Resistance & Bearish Scenario

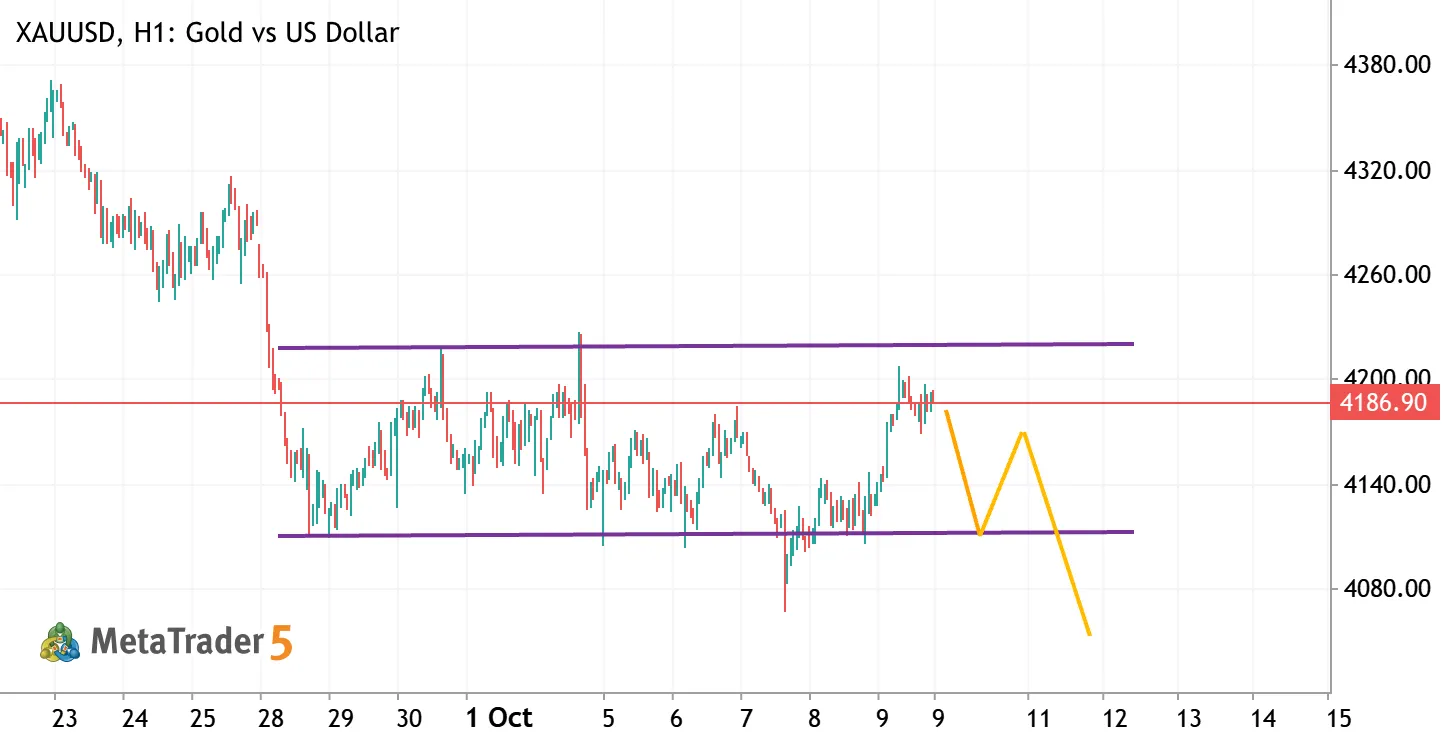
XAUUSD H1 | Bearish Scenario — Key Levels to Watch Market Structure Gold is currently consolidating within a defined H1 trading range, with resistance around 4215–4225 and support near 4110–4120. The recent recovery has brought price back toward the upper half of this range, where selling pressure may reappear. Key Levels Resistance: 4215–4225 Immediate reference: 4185–4190 Major Support: 4110–4120 Extended Bearish Target: 4050–4070 Bearish Scenario If XAUUSD fails to break the upper resistance area and confirms a bearish rejection, price may decline toward the 4110–4120 support zone. A potential rebound from support could follow. However, a confirmed H1 breakdown below this zone, followed by a failed retest, may open the way toward 4050–4070. Alternative Scenario A sustained H1 close
Gold Price Prediction: 4100-4105 Support Holds the Key XAUUSD Gold vs US Dollar

Gold Price Prediction: 4100-4105 Support Holds the Key

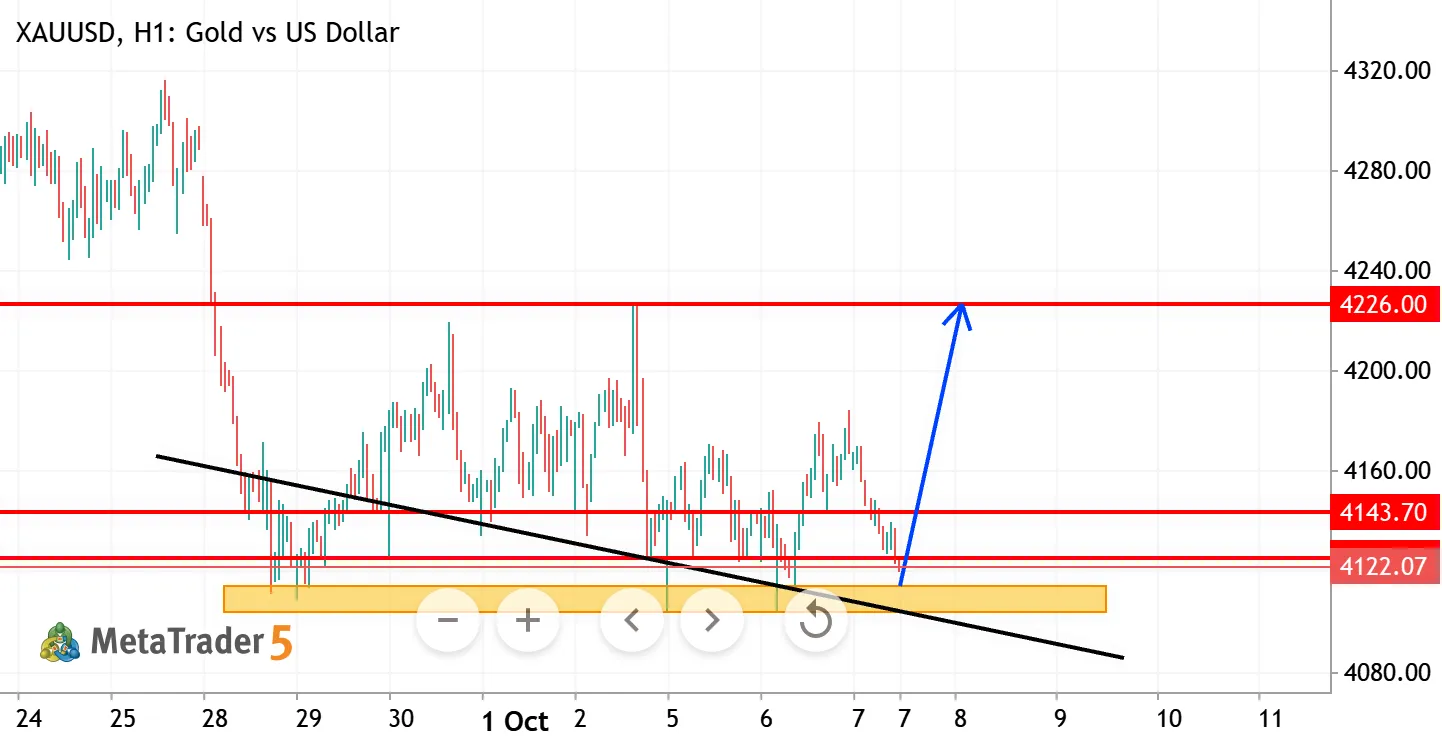
Gold is trading around 4120 zone after finding support near the 4105-4125 area. The 1H chart shows a possible bullish recovery from this support zone with 4143 as the first key resistance. A break and hold above 4143 could push price toward 4160-4180 and eventually 4226 where the major descending trendline resistance sits. However, failure to hold 4105-4125 would keep the bearish structure active and could expose lower levels. Trade Plan-Sell Setup Sell Zone: 4160-4180 Sell Trigger: H1-H4 bearish rejection, bearish engulfing or failure to hold above 4160–4180 Targets: 4143, 4125, 4105, 4080 Extended Target: 4050-4020 Invalidation: H4 close above 4226. A sustained breakout above this area would weaken the bearish structure and could open the way toward 4250-4280. Trade Plan-Buy Setup Buy