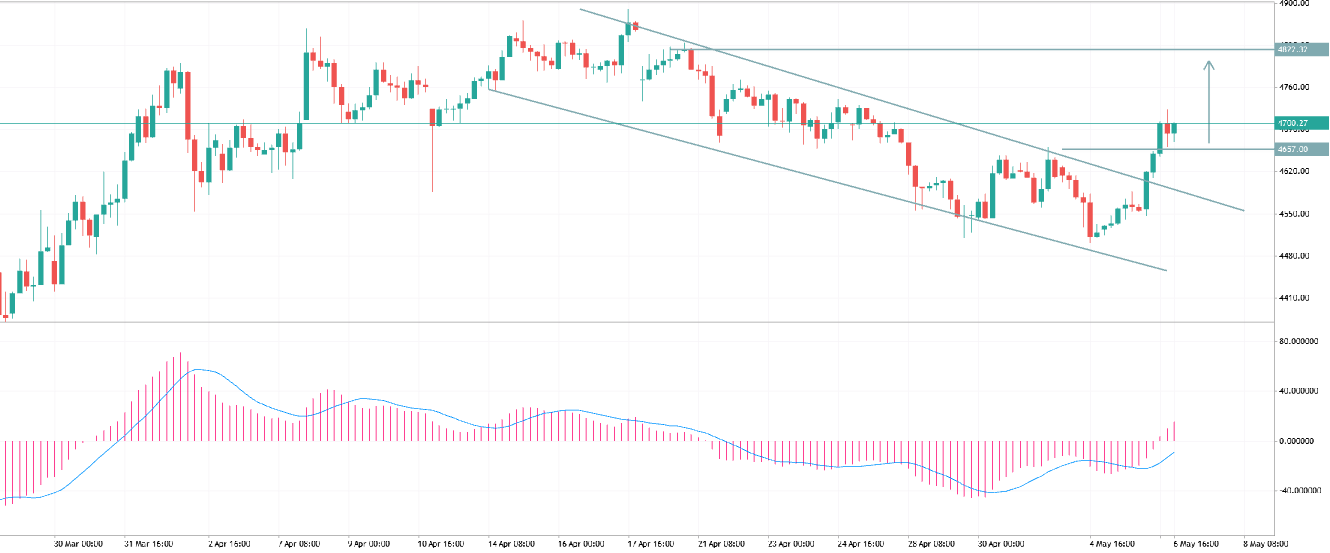
Market Structure
- Price was moving inside a descending channel (downtrend).
- Recently, it has broken above the channel, signaling a potential trend reversal or at least a strong pullback.
Momentum (MACD)
- MACD shows a bullish crossover with histogram turning positive.
- Momentum is shifting upward, supporting the breakout.
Key Levels
- Resistance: 4675–4680 → currently being tested
- Next target: around 4875–4880
- Support (flip zone): 4655–4670
- Strong support: 4540
Price Behavior
- Strong bullish candles pushed price above resistance.
- Price is now holding above breakout zone, which is a bullish sign.
- A retest of 4655–4670 would be healthy for continuation.
Bias
- Short-term: Bullish
Trading Idea
- Buy on dips near 4655–4675
- Target: 4720 → 4875
- Stop loss: below 4540
Invalidation
- If price falls below 4540, bullish setup weakens and downside may continue.
Conclusion
- Breakout + rising momentum = high probability of further upside, as long as price stays above the 4655 zone.

새 코멘트
Have you traded with Cable STRIKER EA?
This is the world's best GBPUSD trading robot
Check it here https://cablestrikerea.com