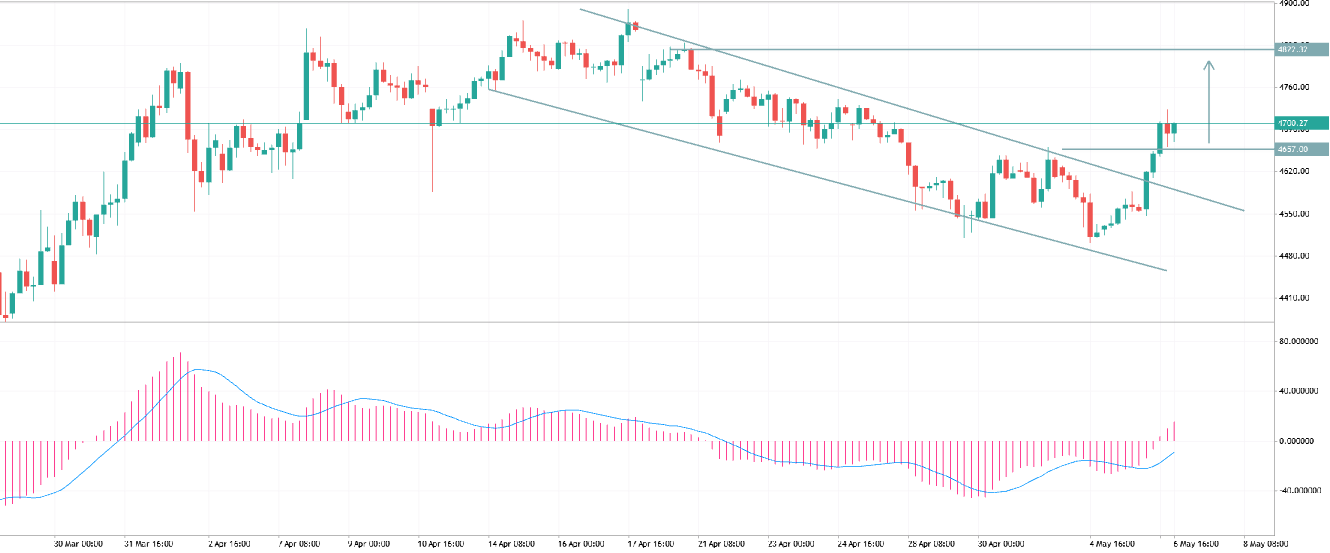
Market Structure
- Price was moving inside a descending channel (downtrend).
- Recently, it has broken above the channel, signaling a potential trend reversal or at least a strong pullback.
Momentum (MACD)
- MACD shows a bullish crossover with histogram turning positive.
- Momentum is shifting upward, supporting the breakout.
Key Levels
- Resistance: 4675–4680 → currently being tested
- Next target: around 4875–4880
- Support (flip zone): 4655–4670
- Strong support: 4540
Price Behavior
- Strong bullish candles pushed price above resistance.
- Price is now holding above breakout zone, which is a bullish sign.
- A retest of 4655–4670 would be healthy for continuation.
Bias
- Short-term: Bullish
Trading Idea
- Buy on dips near 4655–4675
- Target: 4720 → 4875
- Stop loss: below 4540
Invalidation
- If price falls below 4540, bullish setup weakens and downside may continue.
Conclusion
- Breakout + rising momentum = high probability of further upside, as long as price stays above the 4655 zone.

Nuovo commento
Have you traded with Cable STRIKER EA?
This is the world's best GBPUSD trading robot
Check it here https://cablestrikerea.com