

With a market cap of $125.5 billion, S&P Global Inc. (SPGI) is a leading provider of credit ratings, benchmarks, analytics, and workflow solutions across global capital, commodity, and automotive markets. The company operates through five key segments: Market Intelligence, Ratings, Energy, Mobility, and S&P Dow Jones Indices.
Companies valued at $10 billion or more are generally classified as “large-cap” stocks, and S&P Global fits this criterion perfectly. Its offerings range from multi-asset-class data platforms and enterprise software solutions to independent credit ratings, commodity price benchmarks, and automotive industry insights.
More Top Stocks Daily: Go behind Wall Street’s hottest headlines with Barchart’s Active Investor newsletter.
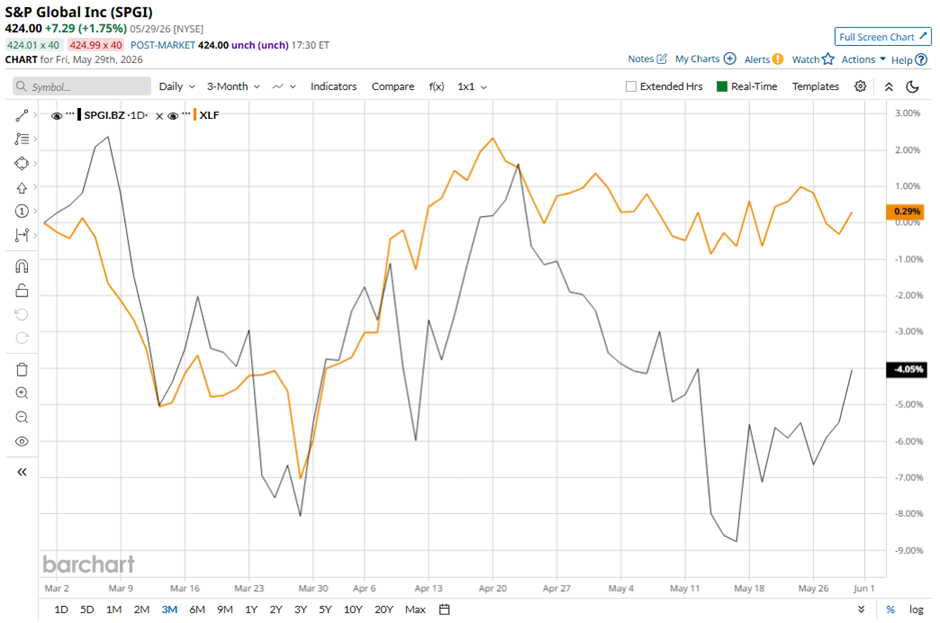
Shares of the New York-based company have declined 26.8% from its 52-week high of $579.05. Over the past three months, its shares have decreased 4.1%, underperforming the broader State Street Financial Select Sector SPDR ETF’s (XLF) marginal rise during the same period.
 www.barchart.com
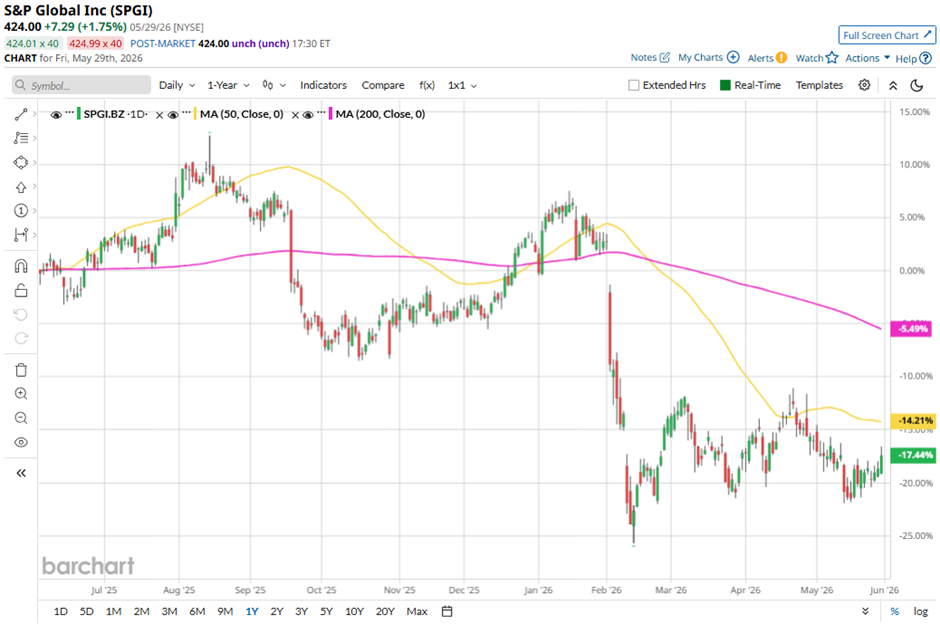
 SPGI stock is down 18.9% on a YTD basis, lagging behind XLF's 5.8% drop. Longer term, shares of the independent ratings and analytics provider have dipped 17.1% over the past 52 weeks, compared to XLF’s nearly 2% return over the same time frame.
Despite a few fluctuations, the stock has been trading below its 50-day moving average since late August and below its 200-day moving average since mid-September last year.
 www.barchart.com
 Shares of S&P Global fell marginally on Apr. 28 as investors reacted to the company's reduced full-year 2026 revenue growth guidance of 6.3% - 8.3%, down from the previous 6.6%–8.6%, primarily due to lower expected foreign-exchange tailwinds. The cautious outlook overshadowed an otherwise strong Q1 2026 in which revenue rose 10% year-over-year to $4.17 billion and adjusted EPS increased 14% to $4.97, both exceeding analyst estimates.
Investor sentiment was also tempered because the company maintained its 2026 adjusted EPS guidance at $19.40 - $19.65, with the midpoint slightly below the consensus expectation.
In comparison, rival Berkshire Hathaway Inc. (BRK.B) has outperformed SPGI stock. BRK.B stock has declined 5.6% YTD and 5.7% over the past 52 weeks.
Despite the stock’s underperformance, analysts remain strongly optimistic about its prospects. The stock has a consensus rating of “Strong Buy” from 26 analysts in coverage, and the mean price target of $542.68 is a premium of nearly 28% to current levels.
On the date of publication, Sohini Mondal did not have (either directly or indirectly) positions in any of the securities mentioned in this article. All information and data in this article is solely for informational purposes. For more information please view the Barchart Disclosure Policy here.
More news from Barchart
Barclays Says Sandisk’s New AI Contracts Could Change the Memory Industry Meta Has a Plan to Monetize Its AI Investments. Its Underperforming Stock Needs It Badly. Jobs Data, Tech Earnings and Other Key Things to Watch this Week After a 13% Selloff, Wolfspeed Now Trades at Steep Discounts. Don’t Be Fooled into Buying the Dip.