


Signet Jewelers Limited SIG posted second-quarter fiscal 2027 results, with the bottom line surpassing the Zacks Consensus Estimate. The top line marginally missed the consensus mark and declined year over year. Adjusted earnings rose sharply year over year, aided by higher adjusted operating income, a lower share count and higher interest income. Same-store sales increased across all fine-jewelry brands, and profitability benefited from cost discipline and tariff refunds. The company raised its fiscal 2027 profit outlook. As a result, SIG's shares gained 24% yesterday following the results.
The quarter reflected continued progress under Signet's Grow Brand Love strategy. Management is accelerating merchandise refreshes, improving online and in-store experiences and updating marketing across its portfolio. The redesigned Jared and Kay websites launched ahead of schedule, while the Zales rollout was expected later in September. Signet also reported higher customer consideration at Kay, Zales and Jared while reducing marketing spending.
Demand remained strongest at higher price points. Comparable sales at price points above $2,000 grew at a high-single-digit rate, helped by a strong Mother's Day period. Timepieces delivered nearly double-digit comparable sales growth, while Bridal posted low-single-digit growth. Fashion comps declined 1%, reflecting weakness at Banter and in lower-priced, metal-focused merchandise, partly offset by growth at middle and higher price points.
Signet Jewelers Limited Price, Consensus and EPS Surprise
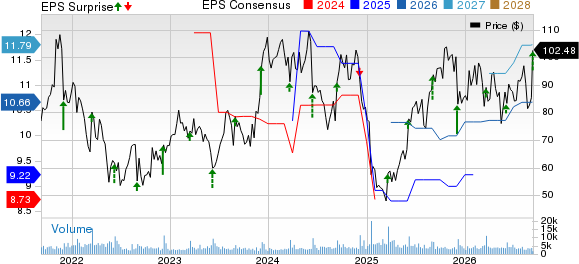
Signet Jewelers Limited price-consensus-eps-surprise-chart | Signet Jewelers Limited Quote
More on Signet’s Q2 Results
SIG reported adjusted earnings of $2.19 per share for the second quarter of fiscal 2027, surpassing the Zacks Consensus Estimate of $1.69. The bottom line increased 36% from adjusted earnings of $1.61 in the year-ago quarter. On a GAAP basis, EPS was $1.33 against a loss of 22 cents a year ago.
This jewelry retailer generated sales of $1,528.1 million, slightly below the consensus estimate of $1,529 million. Sales declined 0.5% from $1,535.1 million in the prior-year quarter. Same-store sales grew 2.2%, marking the fifth positive quarter in the past six quarters, while average merchandise unit retail increased about 6%. The sales decline reflected lower non-same-store sales, including the transition of James Allen and Blue Nile out of the comparable-sales calculation beginning in the quarter.
Signet's Digital Shift Reflects James Allen Move
E-commerce sales declined 5.5% to $300 million and represented 19.6% of quarterly sales compared with 20.7% a year earlier. The company attributed the decline primarily to the decommissioning of the James Allen website, while brick-and-mortar same-store sales increased 2.3%.
Blue Nile reported sales of $83.6 million compared with $74.7 million a year ago, an 11.9% increase. James Allen sales fell to $7.1 million from $36.9 million as the brand transitioned to a proprietary collection within Blue Nile.
Insight Into SIG’s Margins & Expenses
Gross profit was $602.4 million, up 1.8% from $591.9 million in the year-ago quarter. The gross margin expanded 80 basis points to 39.4%. The improvement included approximately $15 million of refunds for tariffs previously paid, which was $13 million above management's expectation, as well as lower inventory and distribution costs. Higher gold costs provided a partial offset.
Adjusted gross profit was $601 million, up from $591.9 million a year earlier. The adjusted gross margin increased 70 basis points to 39.3%. Merchandise margin improved 20 basis points, reflecting core performance in line with expectations and the benefit from tariff refunds.
Selling, general and administrative expenses declined 2.3% year over year to $493.6 million from $505.3 million. As a percentage of sales, SG&A expenses improved 60 basis points to 32.3%, supported by operating-model changes, spending discipline and leverage from positive same-store sales.
Adjusted operating income increased 25.5% to $107.2 million from $85.4 million in the prior-year quarter. The adjusted operating margin expanded 140 basis points to 7%. Adjusted EBITDA rose 18.3% to $152.3 million from $128.7 million, with the adjusted EBITDA margin increasing to approximately 10% from 8.4%.
Update on Signet’s Segmental Performance
Sales in the North America segment increased 0.1% year over year to $1.43 billion in the second quarter of fiscal 2027, which met the Zacks Consensus Estimate. Same-store sales increased 1.9%. The segment’s adjusted operating income rose to $123 million from $103.8 million, while the adjusted operating margin expanded to 8.6% from 7.3%.
International segment sales totaled $96.6 million, increasing 5.2% year over year and 5.8% on a constant-currency basis, surpassing the consensus estimate of $92 million. Same-store sales advanced 6%. The segment's adjusted operating loss narrowed to $1.4 million from $2.1 million in the prior-year quarter.
Update on SIG's Stores
As of Aug. 1, 2026, Signet operated 2,534 stores spanning 4 million square feet of selling space. The store base declined a net 48 locations from the end of fiscal 2026, while selling space decreased 1.1%. North America ended the quarter with 2,282 stores and the International segment operated 252 stores.
Signet’s Financial Snapshot: Cash, Debt & Equity Overview
SIG ended the fiscal second quarter with cash and cash equivalents of $526.8 million, up from $281.4 million in the year-ago period. Inventory was $1.96 billion, down 1% year over year despite higher gold costs. Shareholders' equity stood at $1.84 billion at the quarter-end.
For the first 26 weeks of fiscal 2027, net cash used in operating activities was $73.5 million compared with $89 million in the prior-year period. Capital expenditures were $64.9 million compared with $60.6 million a year ago. Free cash outflow narrowed to $138.4 million from $149.6 million. In the fiscal second quarter alone, Signet generated free cash flow of $30.8 million.
Capital Returns & Consumer Credit Agreement
Signet repurchased approximately 1 million common shares for $87 million during the quarter and an additional 0.4 million shares for about $33 million after the quarter-end. The company plans to initiate a $125-million accelerated share-repurchase program in September. The board expanded the remaining repurchase authorization by roughly $385 million to $700 million. After completing the planned program, approximately $575 million would remain available.
The board declared a quarterly cash dividend of 35 cents per share, payable on Nov. 20, 2026, to shareholders of record as of Oct. 23.
Signet also renewed its consumer credit partnership with Bread Financial through December 2035. The agreement includes quarterly profit sharing and a signing bonus, and management estimates that SIG will generate more than $1 billion of incremental non-comp revenues and operating income over its life. Signet expects an operating benefit of $200-$250 million during the next 36 months and $30-$40 million of non-comp revenues and gross margin benefit in fiscal 2027. The company expects to receive about $80 million of cash in the fiscal third quarter, which will be recognized ratably over the agreement's term. The arrangement does not include loss sharing.
SIG’s Fiscal Q3 Guidance
For the third quarter of fiscal 2027, Signet expects total sales of $1.37-$1.41 billion and same-store sales to range from a decline of 1% to growth of 2%. Adjusted operating income is projected between $31 million and $48 million, while adjusted EBITDA is expected in the band of $82-$100 million.
Fiscal third-quarter outlook includes an expected $7-$9 million benefit from refunds of tariffs previously paid and a $12-$16 million benefit from the new credit agreement beginning in September. Management expects modest SG&A deleverage, as 40-50% of the projected $17-$25 million increase in fiscal 2027 incentive compensation is expected in the quarter.
What to Expect From Signet in FY’27?
Signet maintained its fiscal 2027 sales outlook of $6.7-$6.9 billion. The company raised its same-store sales projection to a range of flat to growth of 2.5% from the prior range of a 0.75% decline to 2.5% growth.
Management expects adjusted operating income of $535-$605 million, up from the previous $480-$560 million. Adjusted EBITDA is projected at $730-$800 million compared with the earlier $665-$745 million. Signet raised its adjusted EPS guidance to $10.45-$12.15 from $9.20-$11.00, an increase of more than 10% at both ends of the range.
The higher profit outlook reflects first-half performance, modestly improved expectations for the back half, the renewed credit agreement, refunds of tariffs previously paid and additional share repurchases. Management said roughly two-thirds of the EPS guidance increase came from the credit agreement, tariff refunds and buybacks, with the remaining one-third attributable to core performance.
The fiscal 2027 outlook assumes a $60-$80 million net sales reduction from the transition of the James Allen brand, about $30 million in tariff refunds and $30-$40 million in non-comp revenues and gross margin from the consumer credit agreement. It incorporates capital expenditures of $150-$180 million, a low-single-digit reduction in net square footage and an annual adjusted tax rate of 23-25%. The adjusted EPS outlook excludes share repurchases after the planned $125-million accelerated program and assumes approximately 38.8 million weighted average shares.
SIG Stock Past Three-Month Performance
Image Source: Zacks Investment Research
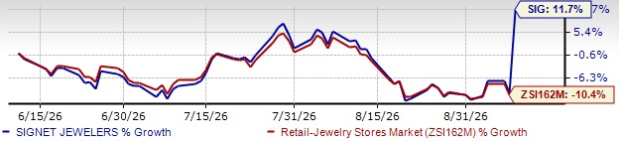
This Zacks Rank #3 (Hold) company’s shares have gained 11.7% over the past three months against the industry’s 10.4% decline.
Stocks to Consider in Retail Space
Movado Group, Inc. MOV is one of the world's premier watchmakers. The company designs, manufactures and distributes watches.Movado Group sports a Zacks Rank #1 (Strong Buy) at present. You can see the complete list of today’s Zacks #1 Rank stocks here.
The Zacks Consensus Estimate for Movado Group’s current financial-year earnings and sales suggests growth of 44.8% and 5.4%, respectively, from the year-ago actuals. MOV delivered a trailing four-quarter average earnings surprise of 117.5%.
Brilliant Earth Group Inc. BRLT is a digital-first jewelry company. The company holds a Zacks Rank #2 (Buy) at present. The Zacks Consensus Estimate for Brilliant Earth Group’s current financial-year earnings and sales suggests growth of 333.3% and 5.2%, respectively, from the year-ago actuals.
Urban Outfitters, Inc. URBN is a lifestyle products and services company that sells fashion apparel, accessories, footwear, home goods and related offerings through a portfolio of global consumer brands. The company carries a Zacks Rank #2 at present.
The Zacks Consensus Estimate for Urban Outfitters’ current fiscal-year earnings and sales suggests growth of 13.2% and 9.3%, respectively, from the year-ago actuals. URBN delivered a trailing four-quarter average earnings surprise of 9.7%.
Research Chief Names "Single Best Pick to Double"
From thousands of stocks, 5 Zacks experts each have chosen their favorite to skyrocket +100% or more in months to come. From those 5, Director of Research Sheraz Mian hand-picks one to have the most explosive upside of all.
This company targets millennial and Gen Z audiences, generating nearly $1 billion in revenue last quarter alone. A recent pullback makes now an ideal time to jump aboard. Of course, all our elite picks aren’t winners but this one could far surpass earlier Zacks’ Stocks Set to Double like Nano-X Imaging which shot up +129.6% in little more than 9 months.
Free: See Our Top Stock And 4 Runners UpWant the latest recommendations from Zacks Investment Research? Today, you can download 7 Best Stocks for the Next 30 Days. Click to get this free report
Signet Jewelers Limited (SIG): Free Stock Analysis Report
Urban Outfitters, Inc. (URBN): Free Stock Analysis Report
Movado Group Inc. (MOV): Free Stock Analysis Report
Brilliant Earth Group, Inc. (BRLT): Free Stock Analysis Report
This article originally published on Zacks Investment Research (zacks.com).