

 MQL5 프로필 열기
차트 & 아이디어
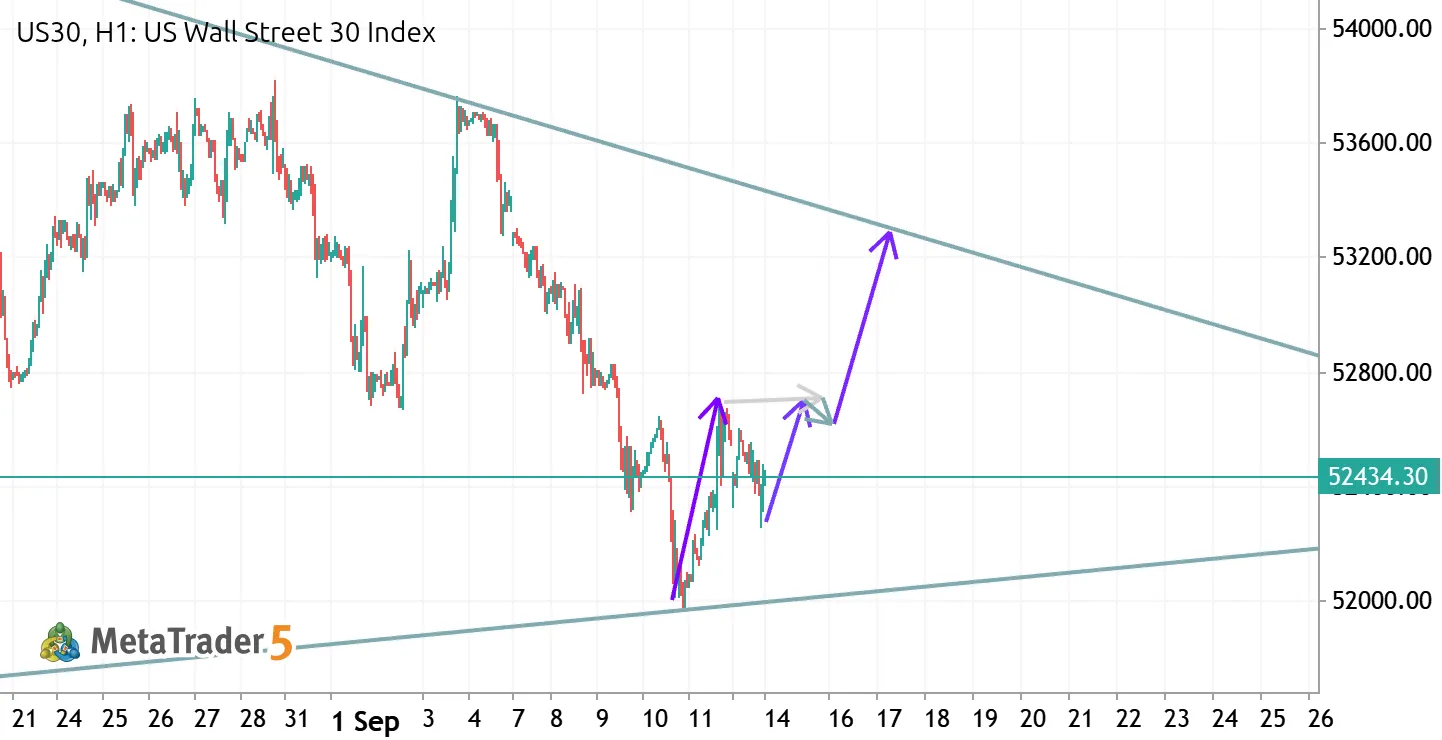
US30 — Inverse Head & Shoulders Building Inside the Triangle
US30 has spent six weeks compressing between the descending resistance off the 5 August high and the rising support that's been in place since late July. Price is now deep into that contraction, and the way the last leg down resolved is what makes this interesting. Instead of breaking the rising trendline, the market carved out a small inverse head and shoulders right on top of it: left shoulder around 52,150, the head at 51,950 where support was tested and rejected on 10 September, and a higher right shoulder near 52,300. That's a textbook sequence of a seller exhaustion — each attempt lower found buyers earlier than the last. The neckline sits around 52,750. A clean H1 close above it opens the measured move toward 53,500, which lines up neatly with the descending trendline in the

Gold Reversal Roadmap
Gold ran hard from about 4000 in late July to a peak near 4690 on Aug 25. Since that top, every rally has failed a little lower than the last — that's the downward-sloping line drawn from the high. Meanwhile the lows around 4280–4300 (mid-August and the Sep 1–3 dip) have held, forming the flat-ish line underneath. Price is now squeezed into the narrowing gap between them, which is why the last two weeks look choppy and directionless. R oadmap: One more leg down. Price slides along under the falling resistance line and drops into the 4280–4300 support zone, roughly mid-September. Notice the up-arrow actually starts below the support line, near 4260 — so the idea allows for a brief dip through support (a stop-run) before it turns. First bounce. A recovery to around 4450, then a pullback to