

 MQL5 프로필 열기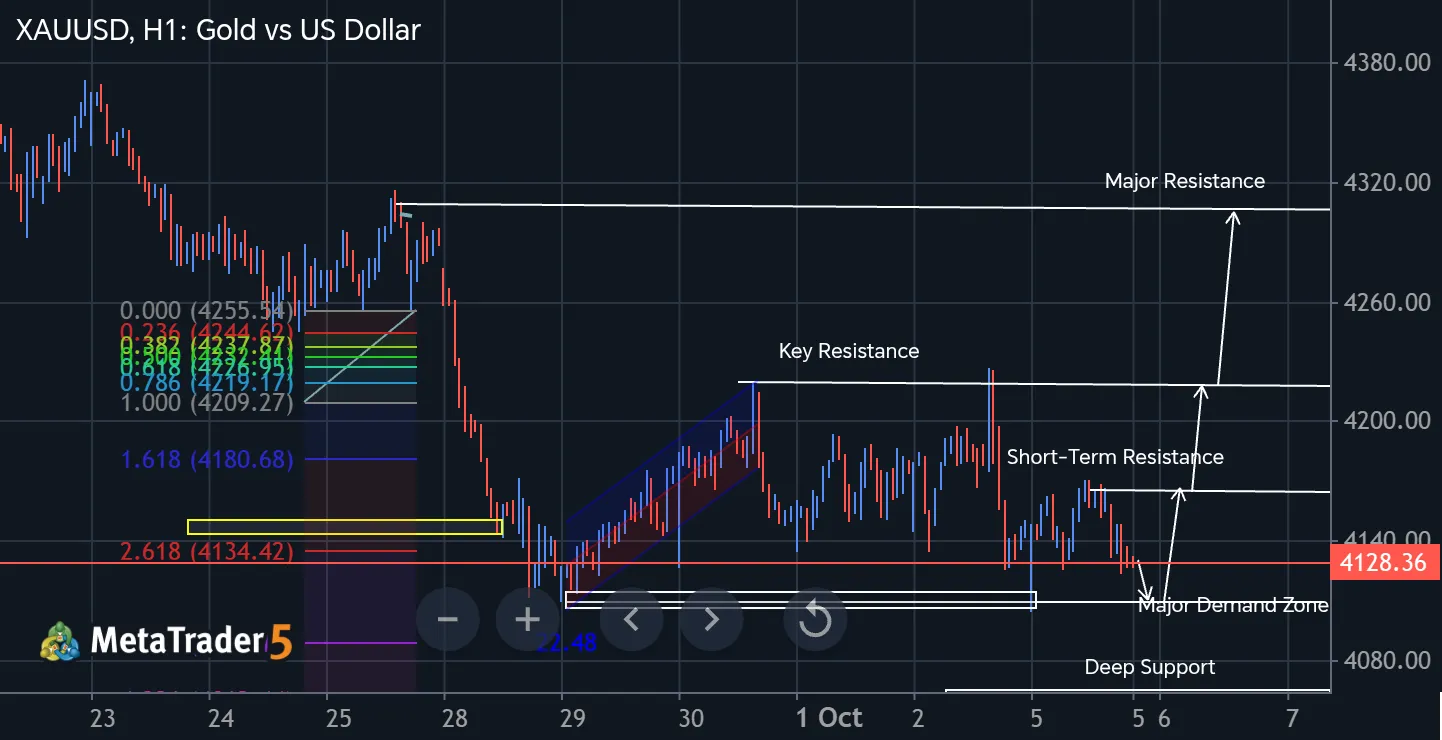
XAUUSD H1 | Market Structure, Fibonacci & Trendline Education
This XAUUSD H1 chart explains price action through market structure, Fibonacci levels, support/resistance and trendline behavior. The chart shows how price reacts from demand, tests resistance, forms higher lows and uses key levels to identify potential bullish or bearish continuation. The main focus is understanding the reaction around 4,110 demand, 4,135 support, 4,160 resistance, 4,220 breakout level and 4,305 major resistance. The Fibonacci levels provide additional confirmation, while the rising channel highlights the current bullish trend structure. Educational flow:
Demand Reaction → Higher Low → Trendline Support → Resistance Test → Breakout Confirmation → Higher Liquidity. Always wait for candle-close confirmation and structure before considering the next potential move.