
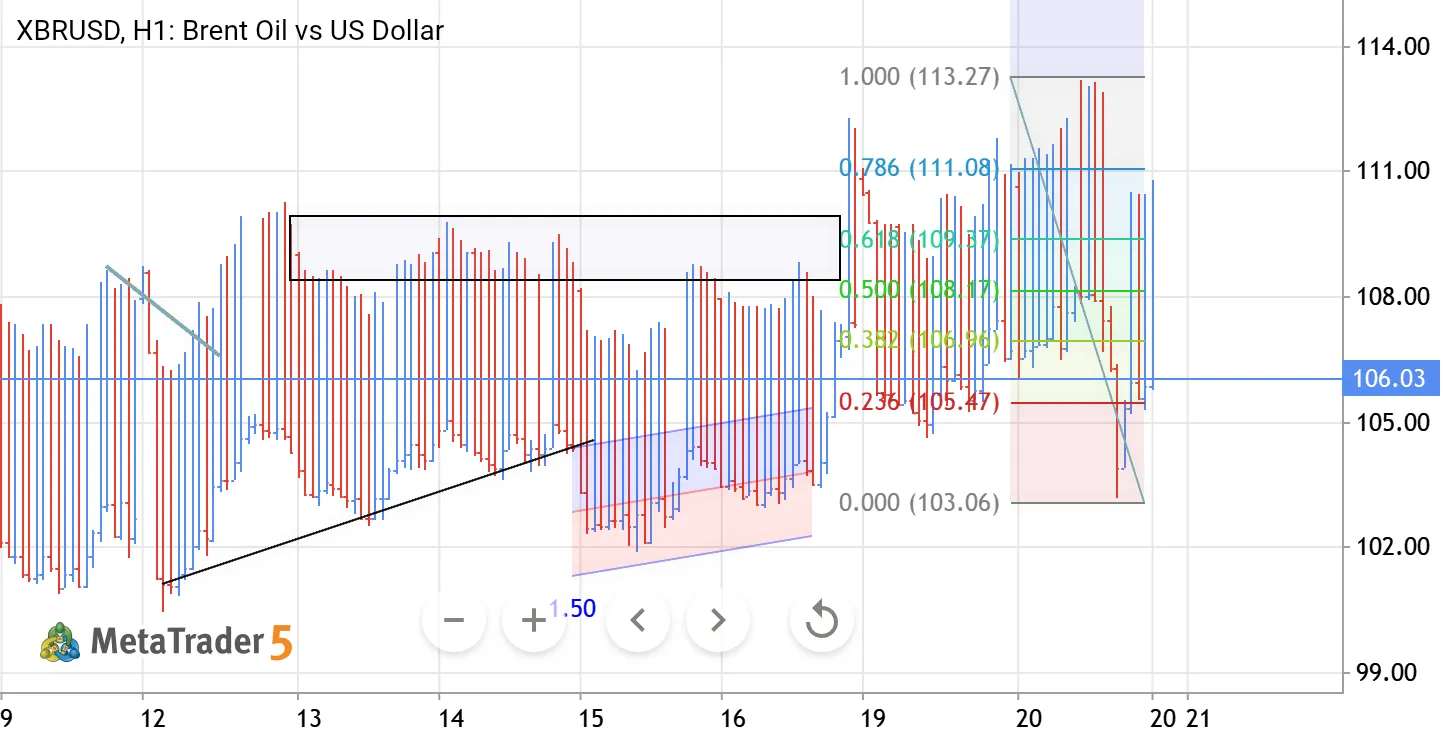
om the 111.00–113.27 resistance zone. The recent move shows strong selling pressure after price failed to sustain the higher Fibonacci levels. The Fibonacci structure highlights 108.16 (0.500) and 109.36 (0.618) as important resistance levels. Price is now below these areas, keeping the short-term structure under pressure. The 105.46 (0.236) level is the immediate support zone. A sustained break below this level could expose the 103.05 Fibonacci base and potentially extend the bearish move. On the upside, reclaiming 108.16–109.36 would weaken the bearish setup and could bring 111.08 back into focus. Key levels: • Resistance: 108.16 → 109.36 → 111.08 • Support: 105.46 → 103.05 • Major resistance: 113.27 This analysis focuses on Fibonacci levels, price structure, and rejection zones. Always follow proper risk management and wait for confirmation before entering a trade.
0

 Perfil no MQL5
Disclaimer:
The information provided does not constitute financial, investment, trading, or other advice or recommendations by MetaQuotes. See the Terms of Use for details.
Novo comentário