Simple Trading Setup with Two Simple Moving Averages
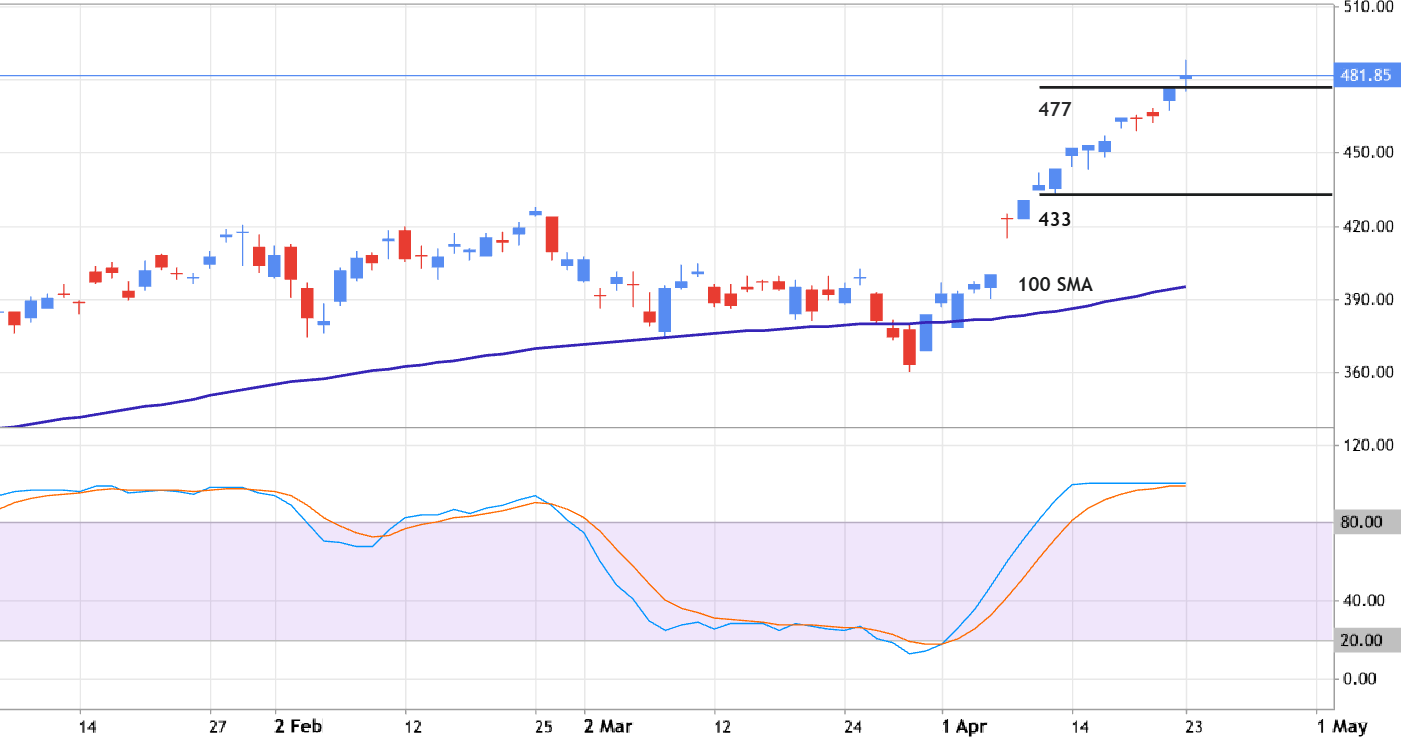
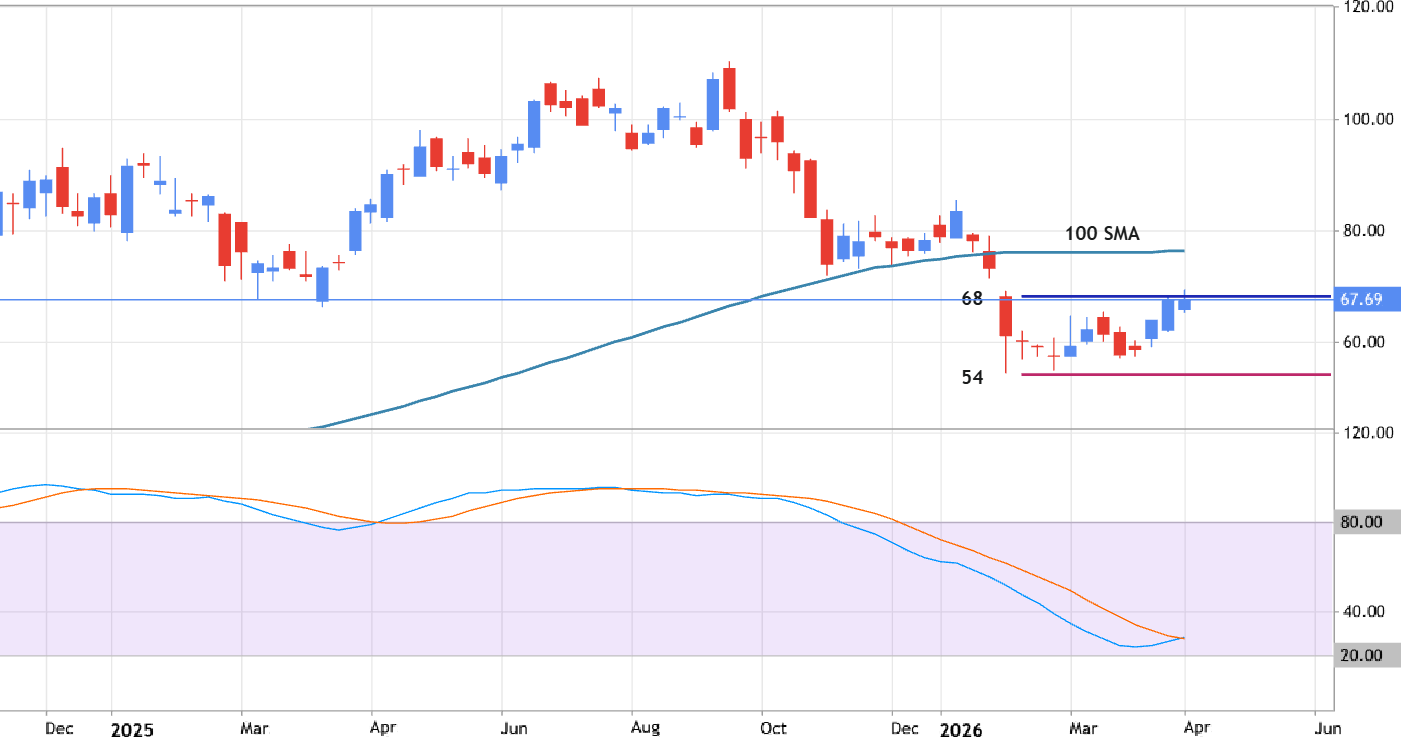
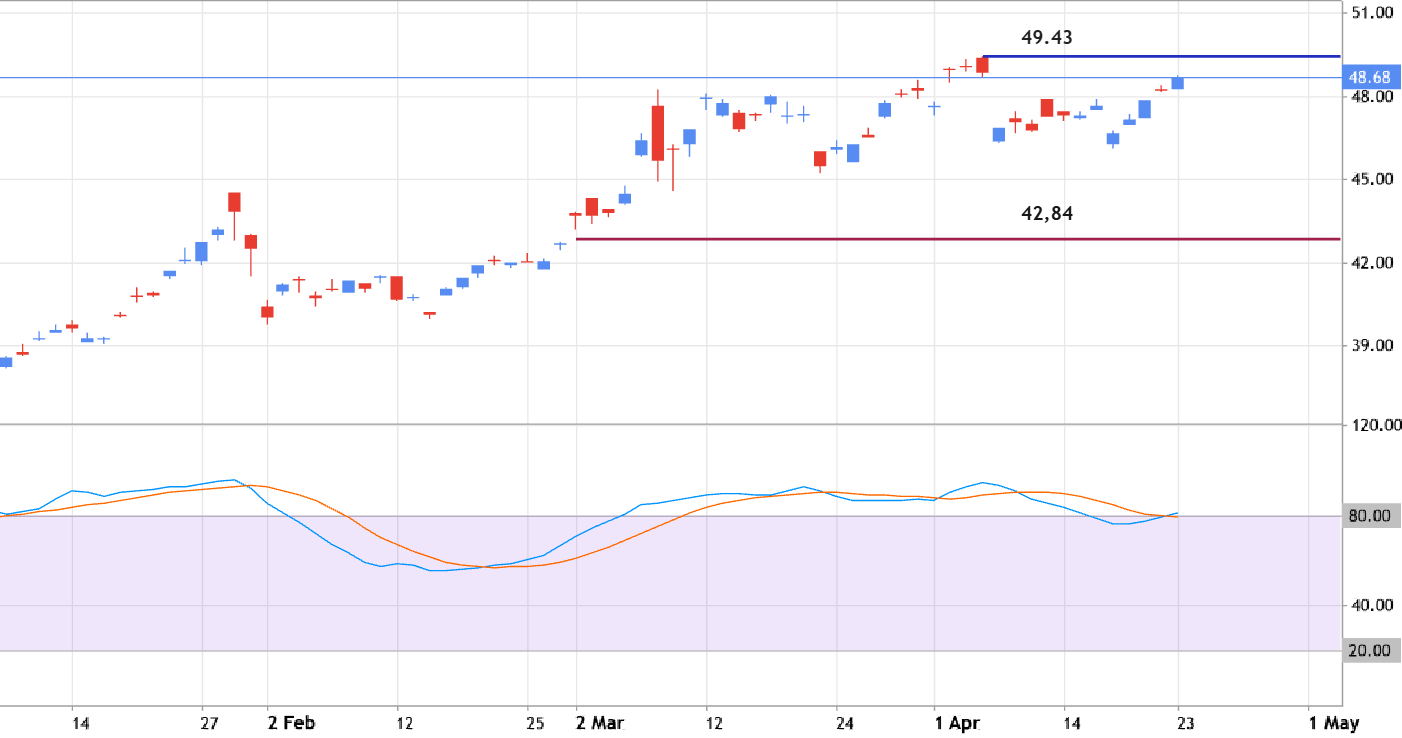
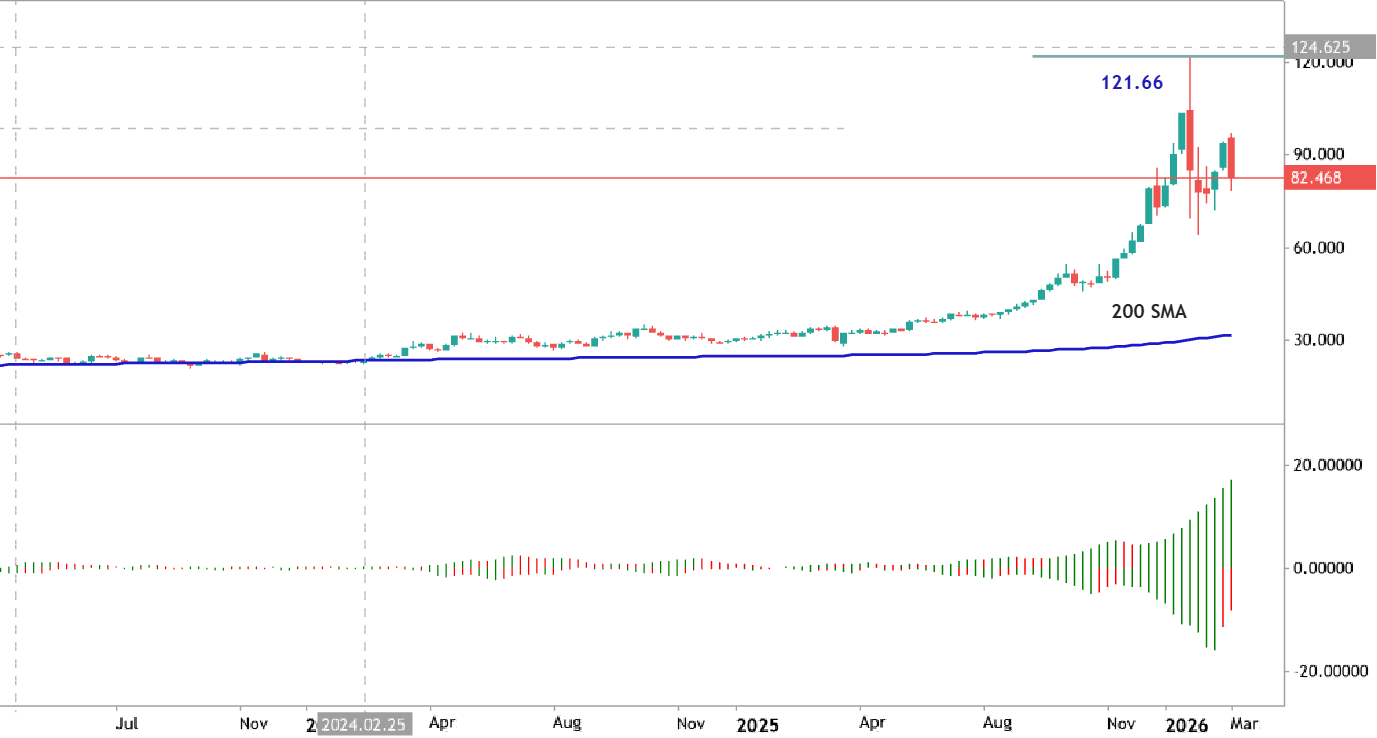
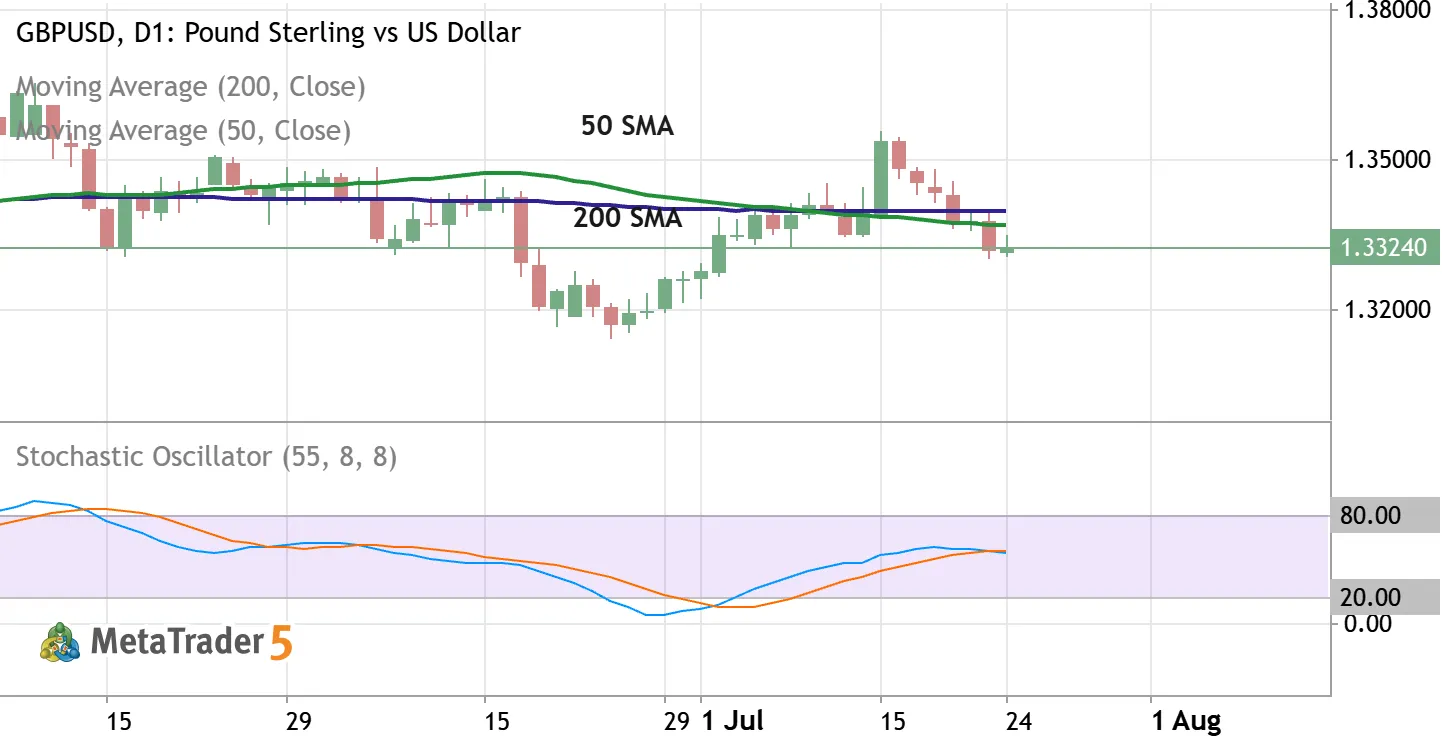
A simple and reliable educational setup. When the 50 SMA crosses above the 200 SMA from below, it signals a potential bullish move. When it crosses below from above, a bearish move may follow. Signals are rare but long-term. Adding Stochastic (55,8,8) helps confirm the momentum - look for it turning above 20 for longs or below 80 for shorts. This is an example about how two moving averages can define the trend.
0