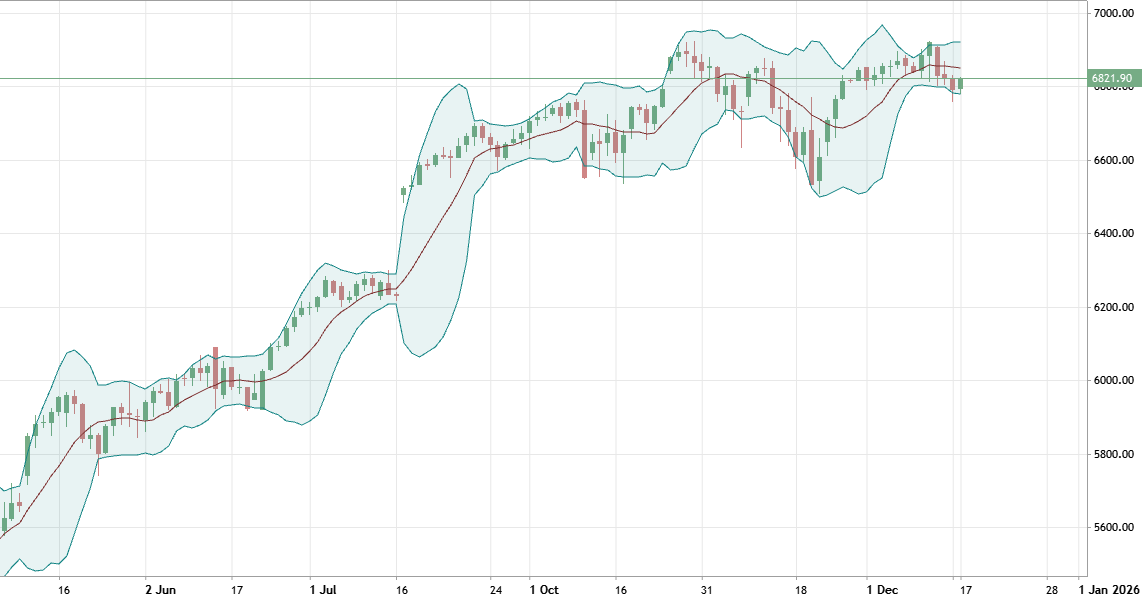
Bollinger Bands indicator was developed by John Bollinger, and this indicator is providing a lot of information, for example: about low volatility- consolidation phase, periods of high volatility- extended trends, support/resistance and buy/sell entry points. The middle line is a simple moving average, the upper line = middle line + standard deviation, lower line = middle line - standard Deviation. Narrowing of Bands is a sign of consolidation and is known as the Bollinger band squeeze, and when the Bollinger Bands display narrow standard deviation it is usually a time of consolidation. The widening of Bands is a sign of a breakout and is known as the Bulge. So, many traders are using this indicator to estimate the market condition on the current timeframe to decide about buy or sell position to be taken for their personal strategy for example.

Novo comentário