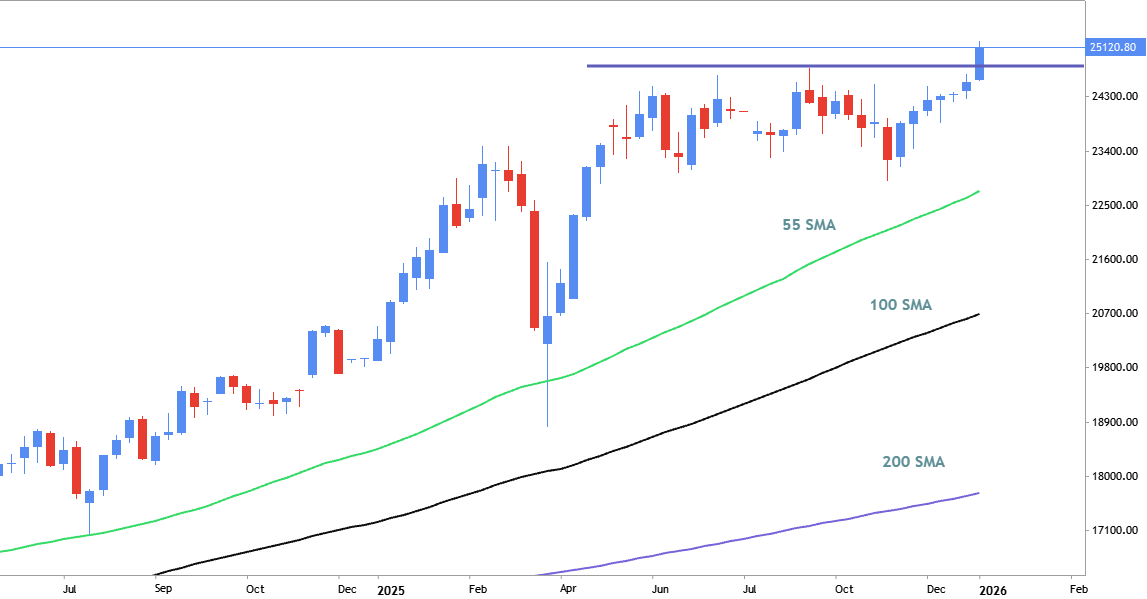
One of the most easy way to estimate the primary trend is 200 SMA. It means the following: if the price is located above 200 SMA so it means that the price is located in the bullish area of the chart; if the price is below 200 SMA so it should be considered as the primary bearish trend. For example, the DE40 weekly price is breaking resistance line at 24800 to above for the strong bullish trend to be continuing (with all SMA indicator's agreement with that). There are some particularities about how to estimate the secondary trend within the primary bearish/bullish which are related to the following: rising/declining 200 SMA line, and the combination of the other SMA indicators (100 SMA and 55 SMA) compare with the located of the price itself. But it may shortly be explained in the part #2.

Novo comentário