

Nvidia, Inc. (NVDA) reported extraordinarily strong revenue and free cash flow (FCF) results for its fiscal Q1 ending April 26. But NVDA stock is down. That could present an attractive buying opportunity for value investors, as this article will show.
NVDA fell 1.9% on Friday, May 22, to $215.33, well below its pre-earnings release peak of $235.74 on May 14, a week before its May 20 earnings release date. A close look at its earnings report shows that Nvidia's fundamental value could be 67% higher.
Can’t Get Enough Options?: Join the list for Barchart’s daily unusual options report, delivered free.
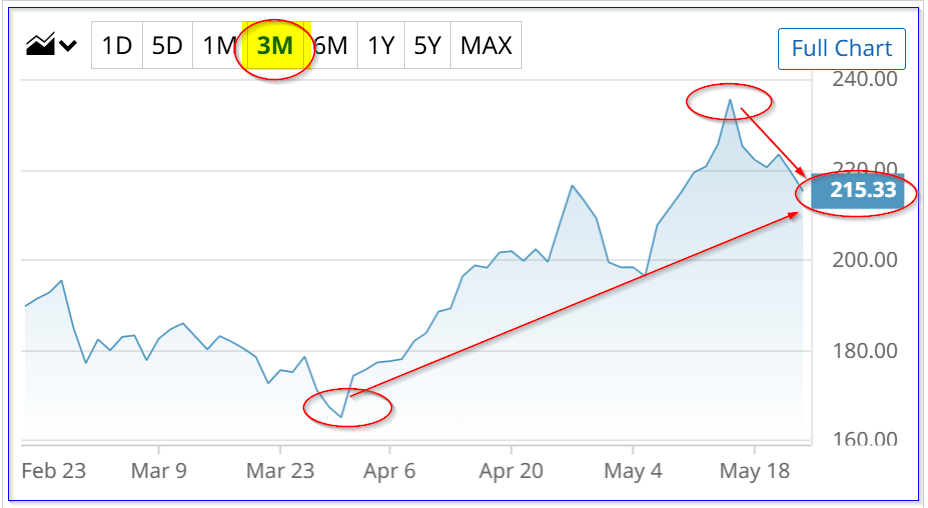 NVDA stock - last 3 months - Barchart - May 22, 2026
 Strong Revenue and FCF Results and Outlook
Nvidia's GPU and CPU chips, software, and systems are at the heart of the AI infrastructure spending boom. That is seen in its stellar results. Revenue spiked 19.8% Q/Q and was up 85.2% Y/Y.
Moreover, its adjusted free cash flow (i.e., operating cash flow or OCF less capex) rose 39.1% Q/Q and 85.8% Y/Y. More importantly, its adj. FCF margins were extraordinarily high: 59.5% of revenue, vs. 51.2% last quarter, and 59.3% a year ago.
This can be seen in data from Nvidia's “CFO Commentary on First Quarter Fiscal 2027 Results," as shown in the table below.
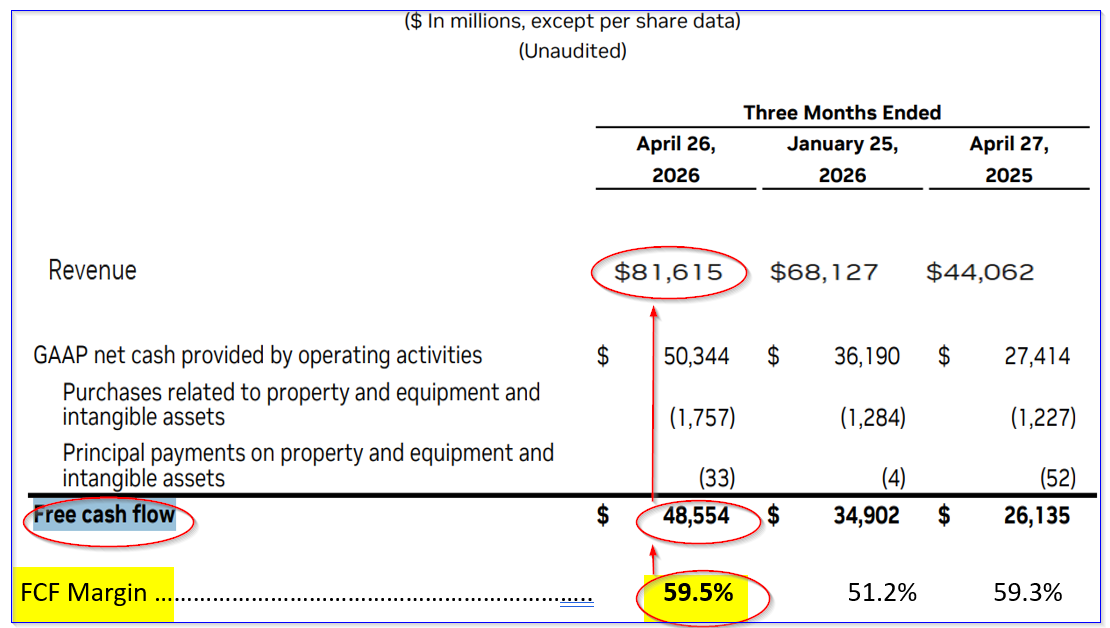 Adj. FCF margins - Nvidia fiscal Q1 - CFO Commentary and Hake analysis
 The point is that as revenue rises, its operating and FCF margins are increasing. That bodes well for future FCF forecasts, especially since analysts project significantly higher revenue.
Projecting FCF
For example, analysts now project revenue could hit $540.45 billion next fiscal year, up from $391.44 billion projected this year, according to both Seeking Alpha and Yahoo! Finance.
As a result, if we assume Nvidia could continue to make at least a 59.3% FCF margin, FCF could rise significantly higher:
$540.45 billion x 0.593 = $320.5 billion FCF FY 2028
That would be over $126 billion, or +65% higher than its present “run-rate” FCF (i.e., $48.554 b Q1 x 4 = $194.2 billion):
$320.5b FY 2028 FCF / $194.2 b run-rate FCF = 1.65, i.e., +65% over the run-rate FCF
The point is that FCF is expected to continue surging. That could push NVDA's value much higher.
Fair Value Using FCF Yield
Management reported that it will pay out 50% of its FCF this year. That is why it increased its dividend to 1.00 per share from 4 cents, and also started a new $80 billion sare share buyback program, on top of its remaining $39 billion authorization.
Given 24.2 billion shares outstanding as of May 15, the dividend payment next year will be at least $24.2 billion. In addition, half of its $320.5 billion in FCF, less $24.2 billion, would imply buybacks of $135.85 billion, of which dividends would be 15%:
$320.5b x 0.5 billion = $160.25 billion share buybacks and dividends
$24.2b / $160.25 = 0.15, i.e., buybacks are 85% of total shareholder returns
Right now, with a $1.00 dividend, the stock has a 0.46% dividend yield (i.e., $1/$215.33). As a result, this implies the FCF yield should be 5.66x higher, or 2.60% :
0.85 buybacks/0.15 dividends = 5.667x,
5.667x 0.46% yield = 2.60%
Price Targets for NVDA
Let's use that FCF yield to value NVDA stock:
$320.5 billion / 0.026 = $12,326 billion, i.e., $12.3 trillion
That is 136% higher than Nvidia's present market cap of $5.216 trillion, according to Yahoo! Finance. That implies NVDA stock could be worth $459.94 per share (2.136 x $215.33).
However, to be conservative, let's assume the FCF yield will be higher at 3.68%. After all, its run-rate FCF of $192 billion (see above) represents 3.68% of Nvidia's $5,216b market cap:
$320.5b / 0.0368 = $8,709 billion
That is still 67% higher than today's market cap of $5,216 billion. In other words, NVDA stock is worth $360 per share:
$215.33 x 1.67 = $359.60 price target (PT)
Other analysts agree that NVDA stock is too cheap. For example, Yahoo! Finance reports that 62 analysts now have an average PT of $294.22, and Barchart's mean survey PT is $296.20. Similarly, Anachart's survey of 38 analysts shows an average PT of $274.30.
Later this week, I will write about several ways for value investors to play NVDA stock, including shorting out-of-the-money puts, as well as buying in-the-money calls.
On the date of publication, Mark R. Hake, CFA did not have (either directly or indirectly) positions in any of the securities mentioned in this article. All information and data in this article is solely for informational purposes. For more information please view the Barchart Disclosure Policy here.
More news from Barchart
Nvidia Hikes Its Dividend and Buybacks Based on Surging FCF - Is NVDA Too Cheap? Option Volatility And Earnings Report For May 25-29 Micron Stock is Up over 133% From Its Lows - But Is MU Still Undervalued? Can November Soybeans Challenge Contract Highs? Strong Crush Demand and Seasonal Strength Say It's Possible