

Apple Inc. (AAPL) delivered strong FY and fiscal Q4 operating cash flow (OCF) and free cash flow (FCF) growth with high FCF margins. One reason is that it hasn't gone all in on capex like other tech stocks. But analysts still see AAPL as at a peak. This article looks at some conservative AAPL plays.
AAPL closed at $342.37 on Friday, Nov. 6, down slightly, but up 2.6% from before the Nov. 2 earnings release ($333.69, 11/2). But can it move higher? Analysts aren't so positive.
Can’t Get Enough Options?: Join the list for Barchart’s daily unusual options report, delivered free.
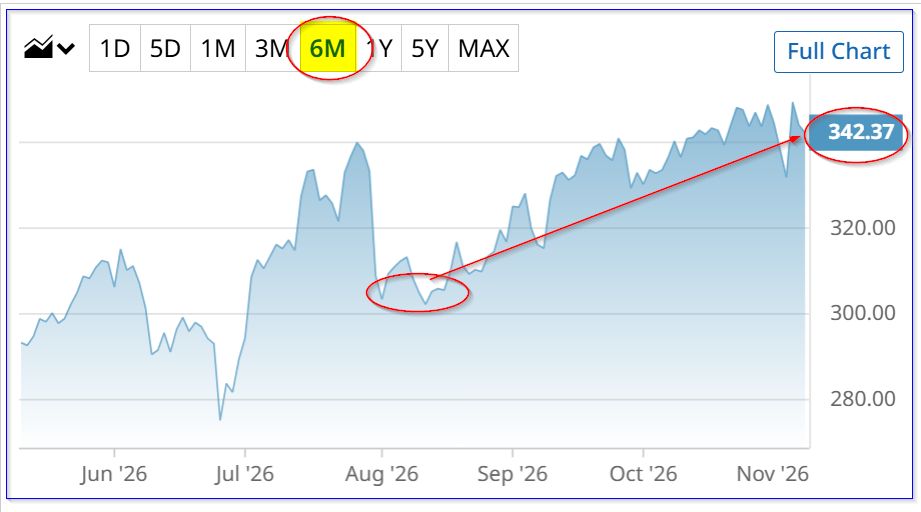 AAPL stock - last 6 months - Barchart - Nov. 6, 2026
For example, the average price target (PT) from a Yahoo! Finance survey of 44 analysts is $339.04, and Barchart's mean survey PT is $339.69. These are both below Friday's close. Moreover, AnaChart's survey of 27 analysts is 3.72% lower at $329.65. AnaChart tends to cover more recent analyst write-ups.
So, is the stock really at a peak? Let's look at its free cash flow prospects and updated valuation.
Strong FCF and FCF Prospects
Apple reported FY 2026 operating cash flow (OCF) (ending Sept. 30, 2026) of $145.1 billion, 30.15% over last year. This represented 30.3% of its annual $478.83 billion revenue, which had risen +15.1%.
But Apple's capex was only $9.04 billion. That was lower than the $12.7 billion spent last year. This is definitely different than the all-in capex trend with other tech companies.
As a result, its free cash flow (FCF) surged 37.8% to $136.056 billion, with a 28.4% FCF margin compared to 23.3% last year (see Stock Analysis data).
Since analysts are projecting 10% higher revenue next year at $527.37 billion, this could imply FCF will rise to almost $150 billion:
$527.37 b x 0.284 = $149.77 billion FCF
One reason for this is that Apple has avoided spending huge amounts on data centers and related capex. Instead, it has partnered with Google and other firms for intelligence. That is a “capex-light” program which is incorporated into its FCF model.
On the other hand, it increased its R&D spending (seen in the income statement) last year by over $11 billion (from $34.55 billion to $45.765 billion). That is a 32.5% increase.
Yet, despite this R&D increase, its OCF and FCF margins stayed strong. As a result, it makes sense to assume the company can keep making relatively high FCF margins.
As a result, assuming $150 FCF for next is still highly likely. That has huge implications for its valuation.
Fair Market Value for AAPL
Over the last year, its $136 billion represented about 3.0% of its $4.975 trillion market cap. It's up about $1 trillion over the past year from $3.939 trillion. In other words, we can estimate AAPL's fair market value (FMV) with a 3.0% FCF yield:
$ 150 B est. 2027 FCF / 0.03 = $5 trillion FMV
But that is only just 0.5% higher than its existing cap.
However, to be fair, we should also use a next 12-month (NTM) estimate for FCF. For example, analysts' revenue targets for the year ending Sept. 28 are $569.27 billion.
So, using three-fourths of the 2027 revenue forecast and one-quarter of the 2028, the NTM revenue estimate is
527.37b x 0.75 ($395.5 billion) + 0.25 x $569.27 ($142.3 billion) = $537.8 billion NTM revenue
So, the NTM FCF is: $537.7b x 0.284 = $152.74 billion, and the FMV is:
$152.74b / 0.03 = $5,091 billion (i.e., $5.09 trillion)
That is 2.33% higher than today's market cap of $4.975 trillion. So the NTM PT is:
$342.37 x 1.0233 = $350.35 PT
The point is that even the best estimate for AAPL's valuation is just 2.3% higher at $350. So, AAPL may be near a peak.
One conservative way to play this is to wait for the stock to fall and buy.
But other plays are to sell short deep out-of-the-money puts or a put credit spread in nearby expiry periods.
Deep OTM Put Credit Spreads
For example, the Dec. 4 expiry put option chain shows that an investor could short the $310 put option (9.5% lower or “out-of-the-money”). However, to do that, an investor must post $31,000 in collateral.
A way around that is to also buy the $295 put as a downside hedge.
The net credit collected would be $90 ($202 - $112). But the collateral required is only $1,500 (i.e., ($310-$295) x 100).
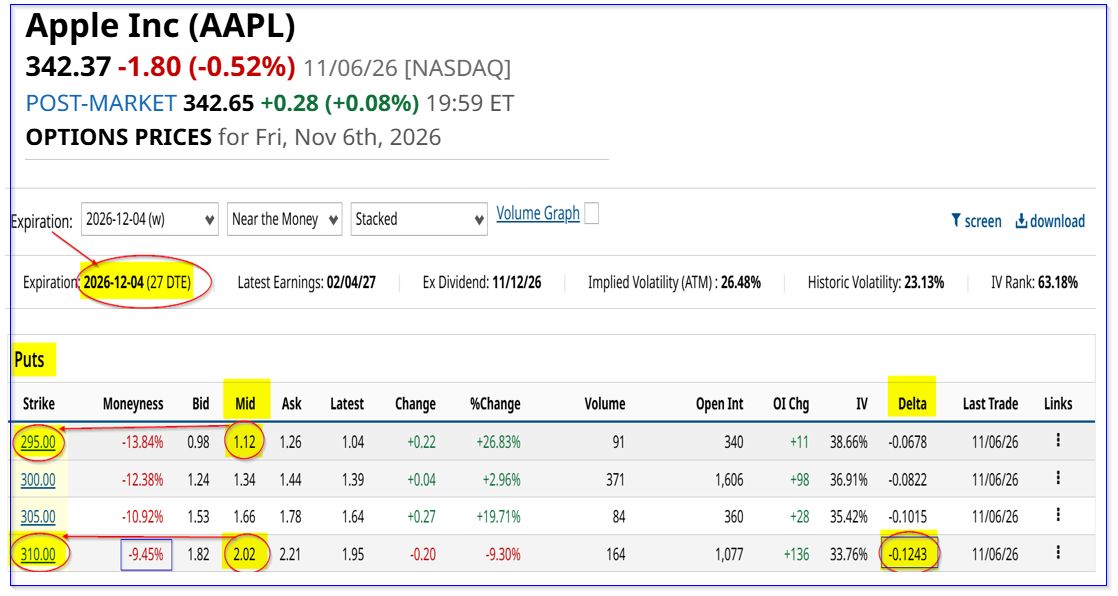 AAPL puts expiring Dec. 4, 2026 - Barchart - As of Nov. 6, 2026
Note that the account must post $1,500 in collateral, but the at-risk amount is only $1,410 ($1,500 - $90). So, the net expected return (ER) is high:
$90 / $1,410 = 6.38% for 4 weeks
Moreover, since the delta ratio at $310 is only -0.1243, there is an implied 87%+ chance of success (i.e., that AAPL won't drop to $310 by Dec. 4).
However, there are huge downside risks. As long as AAPL stays over $310, the collateral won't be lost. But below $309.10 ($310 - $-0.90), the account will begin to lose money.
At $295.00, 100% of the at-risk capital is lost.
So, in effect, this is a bet that AAPL won't drop 9.7% to $309.10 in the next 4 weeks. If you are comfortable with this play, go ahead. Or you can wait for the stock to depreciate a bit and then put on a similar OTM put credit spread.
If you can repeat this play over three months, the expected return is high: 6.38% x 3 = $19.14%.
The bottom line is that AAPL may be near a peak. Shorting OTM puts or put credit spreads are ways to collect income at significantly lower strike prices, even if AAPL falls.
On the date of publication, Mark R. Hake, CFA did not directly have a position in any of the securities mentioned in this article. All information and data in this article is solely for informational purposes. For more information please view the Barchart Disclosure Policy here.
More news from Barchart
Apple Delivers Strong Free Cash Flow, But Analysts See AAPL At a Peak - What's the Best Play? Option Volatility and Earnings Report For Nov 9-13 Airbnb Soars Over 11% After Strong FCF Results - What's the Best ABNB Play Now? Nasdaq Rout Gives Way to Unusual Options Activity and Bullish Bets on Nvidia, AT&T and Alphabet Stocks