


F.N.B. Corporation FNB reported second-quarter 2026 earnings of 42 cents per share, which matched the Zacks Consensus Estimate. The bottom line jumped 16.7% year over year.
Results primarily benefited from higher net interest income (NII), a rise in non-interest income and lower provisions. Higher average loans and deposits were other positives. However, higher non-interest expenses hurt the results to some extent.
Net income available to common shareholders was $148.7 million, up from $130.7 million in the prior-year quarter. Our estimate for net income available to common shareholders was $147.9 million.
FNB’s Revenues Improve, Expenses Rise
Total revenues were a record $462.7 million, up 5.6% from the year-ago quarter. However, the top line missed the Zacks Consensus Estimate of $468 million.
NII was $365.7 million, up 5.3% from the prior-year quarter. The rise reflected growth in average earning assets and lower interest-bearing deposit costs, partially offset by lower yields on earning assets. The net interest margin (NIM) (FTE basis) expanded 6 basis points (bps) year over year to 3.25%. Our estimates for NII and NIM were pegged at $370.5 million and 3.27%, respectively.
Non-interest income was $97 million, up 6.5% year over year. The rise was primarily driven by higher capital markets income, bank-owned life insurance, dividends on non-marketable equity securities, trust services fees and other income. Our estimate for the metric was $94.9 million.
Non-interest expenses were $253.2 million, up 2.9% year over year. The rise was due to an increase in almost all cost components, except for marketing costs, FDIC insurance expenses and other costs. Our estimate for non-interest expenses was $254.7 million.
At the end of the second quarter, average total loans and leases were $35.5 billion, up 2.9% from the prior-year quarter, while average total deposits were $38.7 billion, up 4.1%. Our estimates for average total loans and leases and average total deposits were $35.4 billion and $39.3 billion, respectively.
F.N.B. Corp’s Credit Quality Improves
FNB’s provision for credit losses was $21.4 million, down 16.6% from the prior-year quarter. Our estimate for provisions was $23 million. Net charge-offs were $17 million, down from $21.8 million a year ago.
Also, the ratio of non-performing loans plus other real estate owned (OREO) to total loans and leases plus OREO decreased 3 bps year over year to 0.31%. However, total delinquency increased 9 bps to 0.71%.
FNB’s Capital Ratios Improve
As of June 30, 2026, the common equity Tier 1 (CET1) ratio was 11.4%, up from 10.8% in the prior-year quarter. Tangible common equity to tangible assets ratio (non-GAAP) increased to 8.93% from 8.47%.
FNB’s Share Repurchase Update
In the second quarter, F.N.B. Corp repurchased 2.7 million shares for $47 million at a weighted average share price of $17.46.
Our View on FNB
Weak asset quality and huge commercial loan exposure are expected to hurt FNB’s financials to an extent in the near term. Persistently rising expenses, mainly because of the company’s continued investments in franchise and digitization efforts, will likely hurt the bottom line.
F.N.B. Corporation Price, Consensus and EPS Surprise
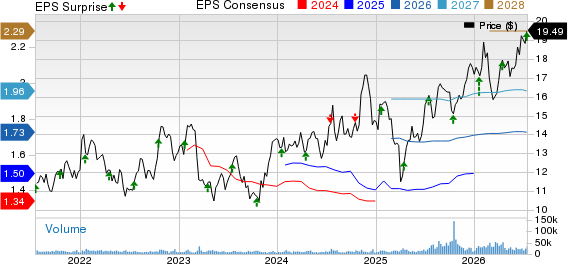
F.N.B. Corporation price-consensus-eps-surprise-chart | F.N.B. Corporation Quote
Currently, FNB carries a Zacks Rank #4 (Sell).
You can see the complete list of today's Zacks #1 Rank (Strong Buy) stocks here.
Performance of Other Banks
The Bank of New York Mellon Corporation’s BNY second-quarter 2026 adjusted earnings of $2.46 per share handily surpassed the Zacks Consensus Estimate of $2.20. The bottom line increased 26.8% from the year-ago quarter.
BNY’s results primarily benefited from a rise in fee revenues and NII. Also, the company recorded a provision benefit in the quarter, which was a tailwind.
Bank of America’s BAC second-quarter 2026 earnings of $1.21 per share handily surpassed the Zacks Consensus Estimate of $1.13. The bottom line grew 34.4% year over year.
BAC recorded an improvement in trading numbers for the 17th straight quarter. The company’s investment banking performance was solid this time as well. These, along with higher NII, drove Bank of America’s total revenues. While provisions declined in the quarter on a year-over-year basis, non-interest expenses increased, which hurt the results to some extent.
7 Best Stocks for the Next 30 Days
Just released: Experts distill 7 elite stocks from the current list of 220 Zacks Rank #1 Strong Buys. They deem these tickers "Most Likely for Early Price Pops."
Since 1988, the full list has beaten the market more than 2X over with an average gain of +23.9% per year. So be sure to give these hand picked 7 your immediate attention.
See them now >>Want the latest recommendations from Zacks Investment Research? Today, you can download 7 Best Stocks for the Next 30 Days. Click to get this free report
F.N.B. Corporation (FNB): Free Stock Analysis Report
Bank of America Corporation (BAC): Free Stock Analysis Report
BNY (BNY): Free Stock Analysis Report
This article originally published on Zacks Investment Research (zacks.com).