

META
#8
Meta Platforms, Inc. - Class A Common Stock
642.6 2 USD
-0.01%
Preço de mercado
Setor: Serviços de comunicação
Base: USD
Moeda do lucro: USD
Faixa diária
Faixa anual
Mudança diária
-0.96%
Mudança mensal
-16.42%
Mudança em 6 meses
-4.23%
Mudança anual
-14.27%
Fechamento anterior
648.8 5
Abertura
638.1 2
Mínimo
633.2 7
Máximo
648.0 4
Indicadores financeiros
2014
Quarterly report, Q2 FY2014
Meta Platforms, Inc. quarterly report, Q2 FY2014
10-Q
Current report, 22 May 2014
Meta Platforms, Inc. current report, 22 May 2014
8-K
Current report, 18 Apr 2014
Meta Platforms, Inc. current report, 18 April 2014
8-K
Quarterly report, Q1 FY2014
Meta Platforms, Inc. quarterly report, Q1 FY2014
10-Q
Current report, 24 Mar 2014
Meta Platforms, Inc. current report, 24 March 2014
8-K
Current report, 19 Feb 2014
Meta Platforms, Inc. current report, 19 February 2014
8-K
Current report, 29 Jan 2014
Meta Platforms, Inc. current report, 29 January 2014
8-K
2013
Annual report, FY2013
Meta Platforms, Inc. annual report, FY2013
10-K
Current report, 20 Dec 2013
Meta Platforms, Inc. current report, 20 December 2013
8-K
Current report, 30 Oct 2013
Meta Platforms, Inc. current report, 30 October 2013
8-K
Notícias
Ações da semana no Investing.com
Venda de chips de IA está "descolada dos fundamentos", diz LYNX
Advogados do Novo México podem receber até US$1,27 bilhão em caso contra a Meta
Novas ações sem direito a voto da Meta visam proteger o controle de Zuckerberg
Meta é a principal aposta em IA do Bank of America, que eleva preço-alvo
Planos de captação da Meta revelam fraqueza no boom da IA
Argus reitera recomendação de compra da Meta após acordo judicial
Futuros do TSX caem com recuo do ouro e temores sobre IA
Ações da Mercari disparam com parceria de IA da Meta no Japão
Bolsas da Ásia sobem na maioria, mas petróleo e temores com IA limitam ganhos
+123%, +34%, +31%: Big Techs tropeçam enquanto ações fora do radar brilham
Gráficos e ideias
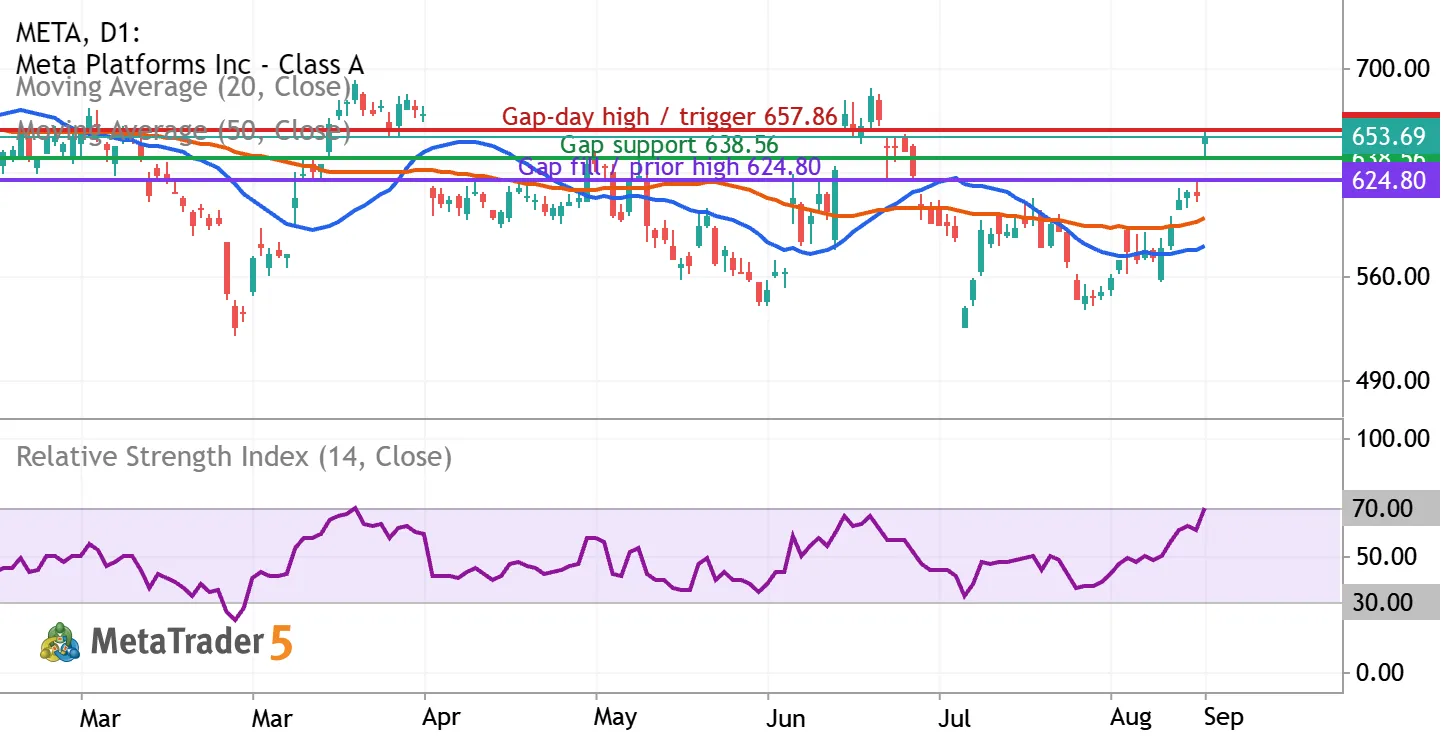
META: gap-up rally puts $638.56 support in focus
Meta Platforms (NASDAQ: META) | Daily chart | September 10, 2026 View: conditionally bullish, with patience after a sharp gap higher. Horizon: 2–4 weeks. META closed September 9 at $653.69, up 6.55%. The session low of $638.56 stayed above September 8’s $624.80 high, leaving an unfilled daily gap. Holding that gap would support continuation; a failure would weaken the breakout. Reading the indicators The blue line is the 20-day simple moving average, the orange line the 50-day simple moving average, and the lower panel is RSI(14), all using closing prices. At the September 9 candle, MetaTrader showed approximately $580.54, $598.58, and 70.43 respectively. Price is above both averages, but the 20-day average remains below the 50-day: this is a strong recovery without a fully bullish


No momento, não há outras ideias de trading para META
Veja ideias de trading prontas ou selecione um símbolo e crie a sua
Ir para gráficos e ideias de trading