
Sharing technical analysis and market insights
Focused on price action & smart money concepts
For educational purposes only
Gráficos e ideias
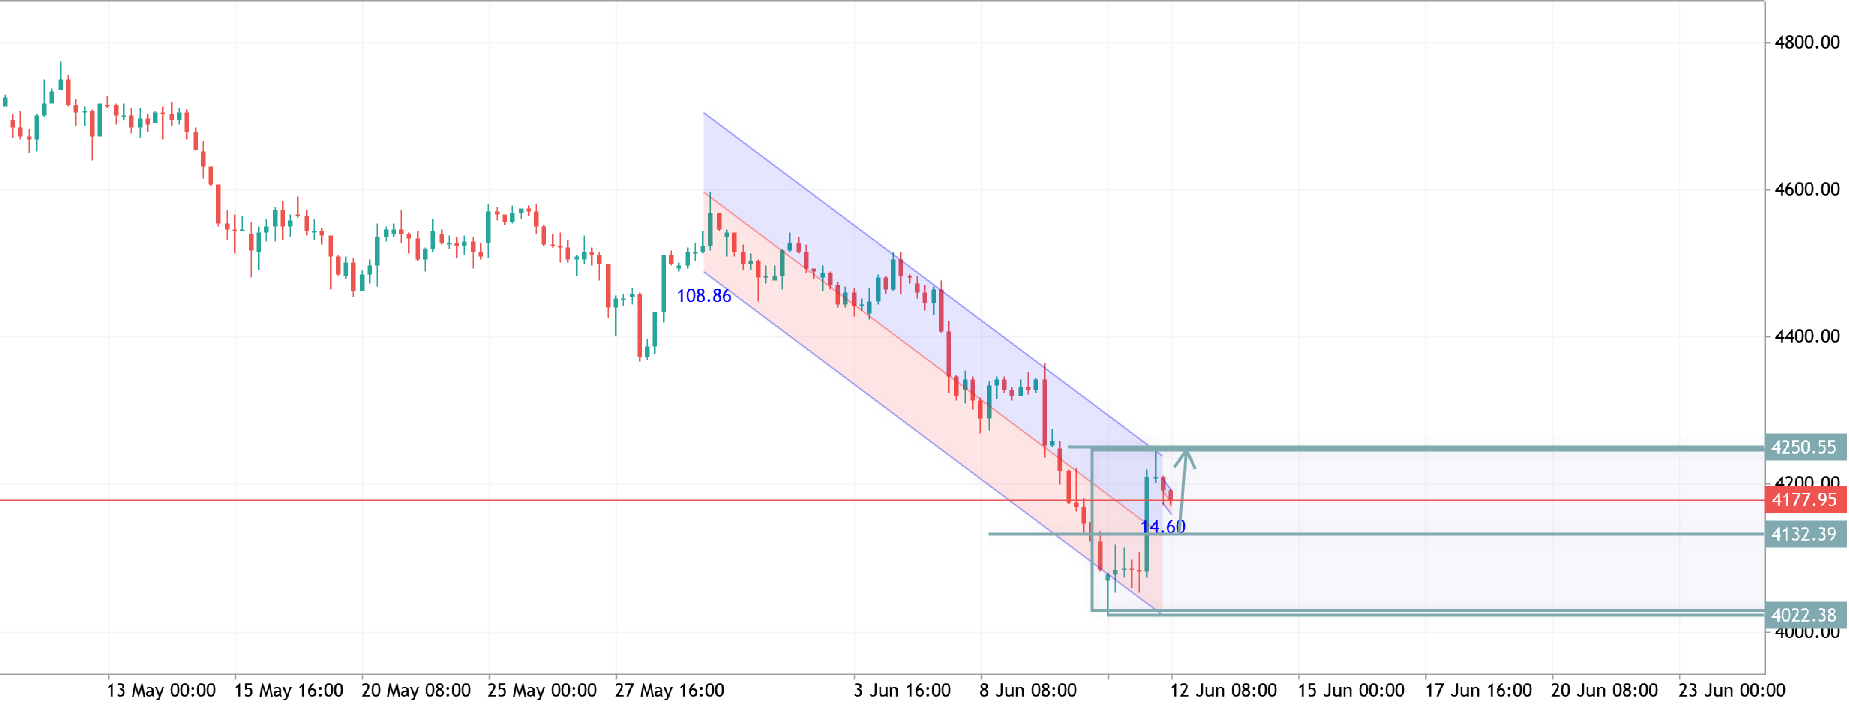
XAUUSD H4 ANALYSIS
XAUUSD H4 Analysis Gold is showing signs of a bullish correction after a strong decline within the descending channel. Price has reacted from key support and is attempting to break higher, targeting the next resistance zone around 4250–4270. A confirmed breakout above resistance could extend the recovery, while failure may keep the broader bearish trend intact. 📈 Bias: Short-term Bullish Correction 🎯 Targets: 4250 → 4270 ⚠️ Key Support: 4025–4050 Trade with proper risk management and wait for confirmation before entering positions.
2026.06.12 06:06 0 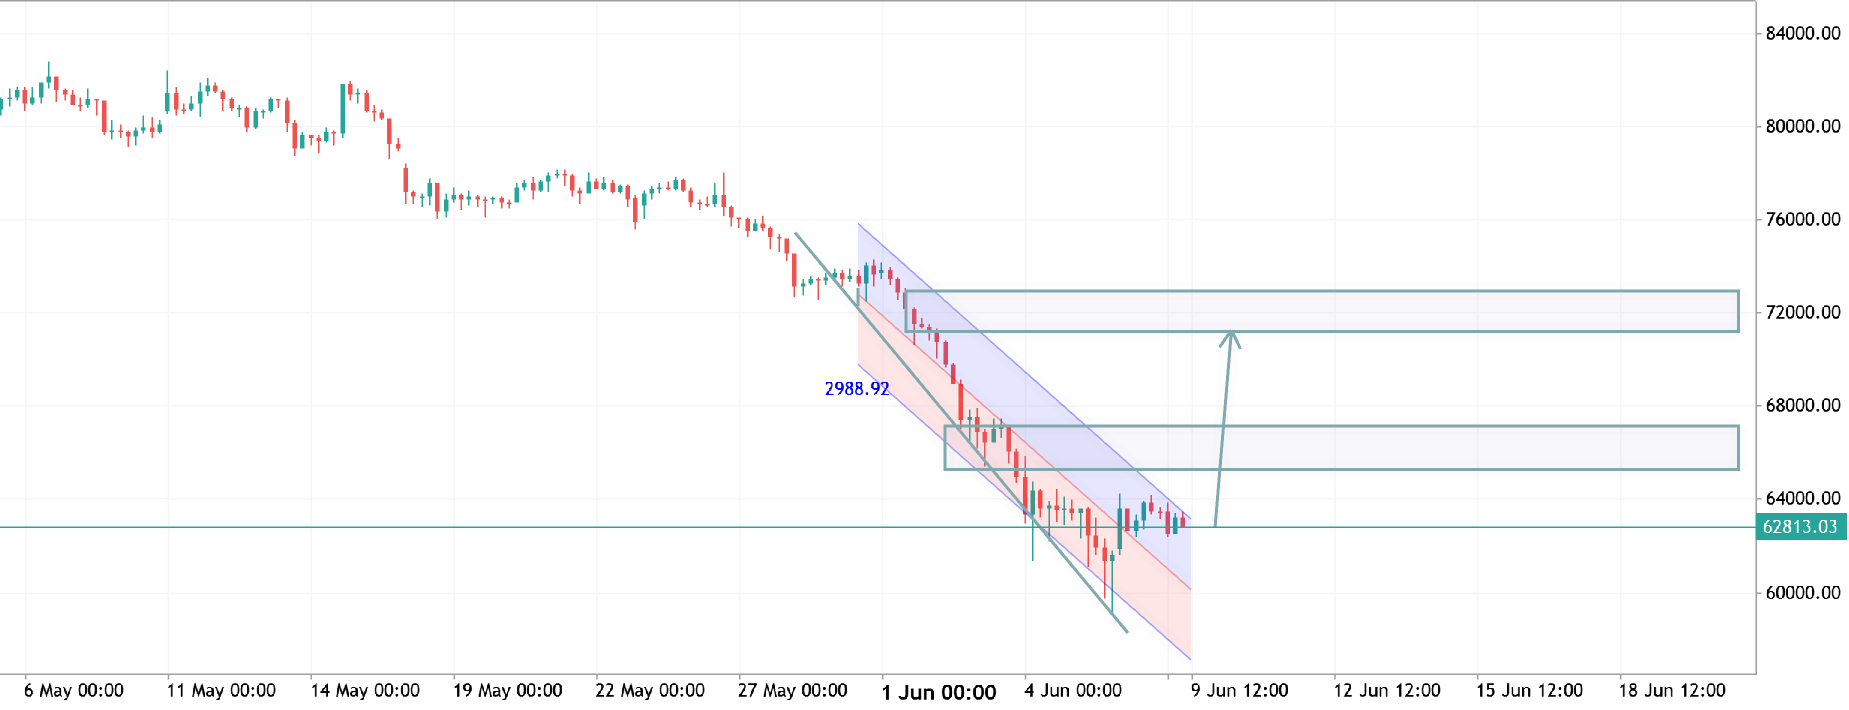
BTCUSD H4 ANALYSIS
BTCUSD Technical Outlook BTC is showing signs of a bullish reversal after breaking out of a descending channel. Price has reclaimed short-term structure and is attempting to build momentum from the recent lows. 📈 Bullish Scenario: A sustained move above 64,500 could accelerate buying pressure toward 67,000–72,000. 🔹 Support: 62,000–63,000 🔹 Resistance: 64,500, 67,000, 72,000 Market Bias: Bullish while price remains above the channel breakout zone. Higher lows suggest buyers are regaining control. Disclaimer: This analysis is for educational purposes only and not financial advice. Always use proper risk management before trading.
2026.06.09 09:03 0 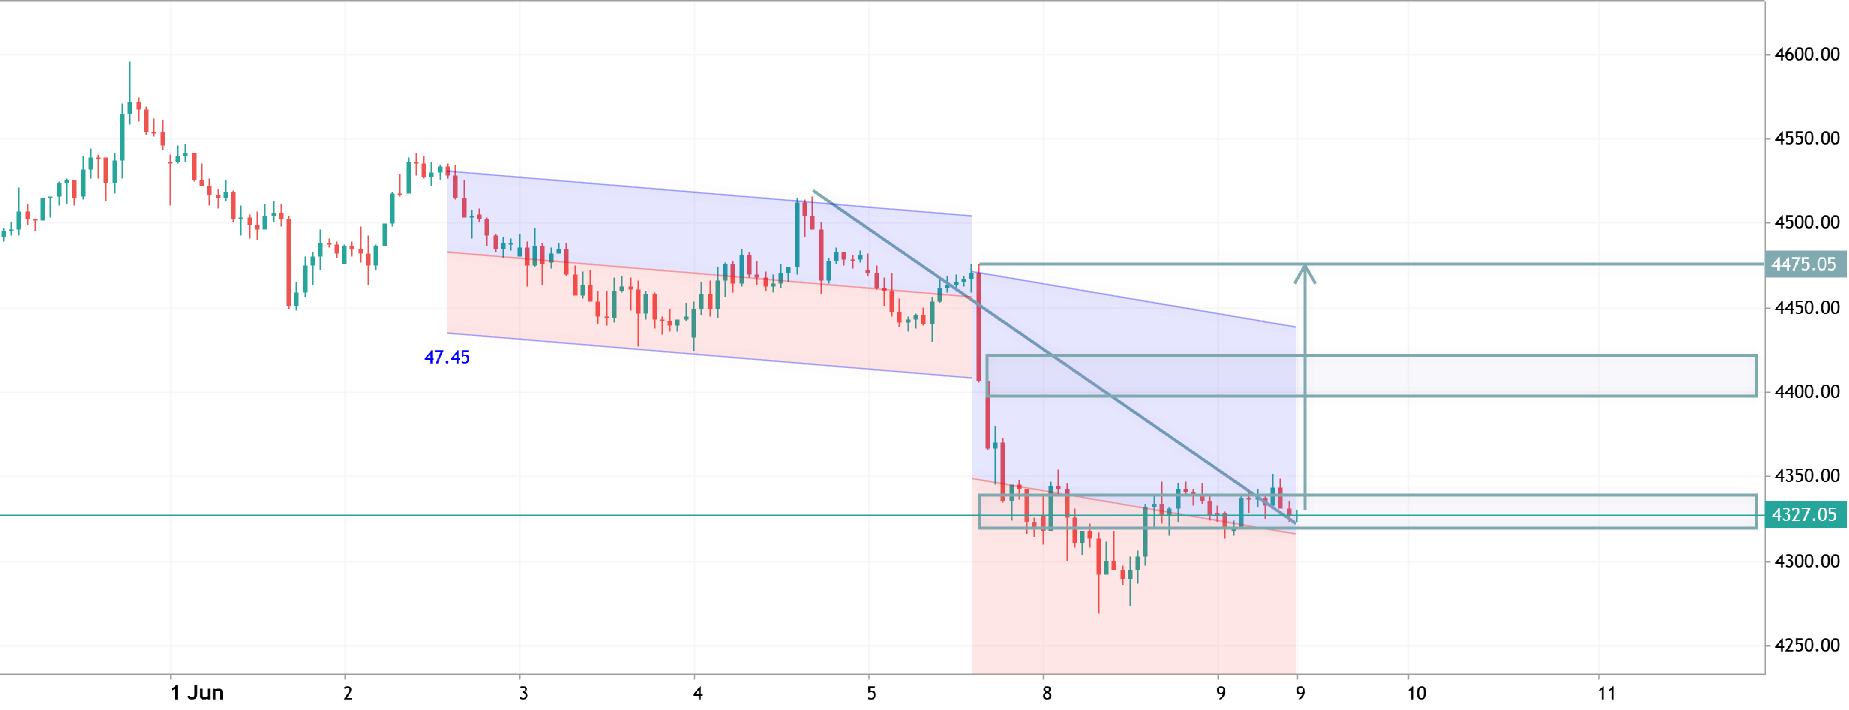
XAUUSD H1 ANALYSIS
XAUUSD Technical Outlook Price is attempting a bullish breakout from a descending trendline after forming a strong base around the 4300 support zone. Buyers are defending the lower range, and a sustained move above resistance could open the path toward 4400–4450. Key Levels 🔹 Support: 4300–4280 🔹 Resistance: 4375, 4400, 4450 Market Bias: Bullish above 4300. A confirmed breakout may trigger further upside momentum, while rejection at resistance could lead to short-term consolidation. Disclaimer: This analysis is for educational purposes only and not financial advice. Always manage risk and use proper confirmation before entering trades.
2026.06.09 08:53 0 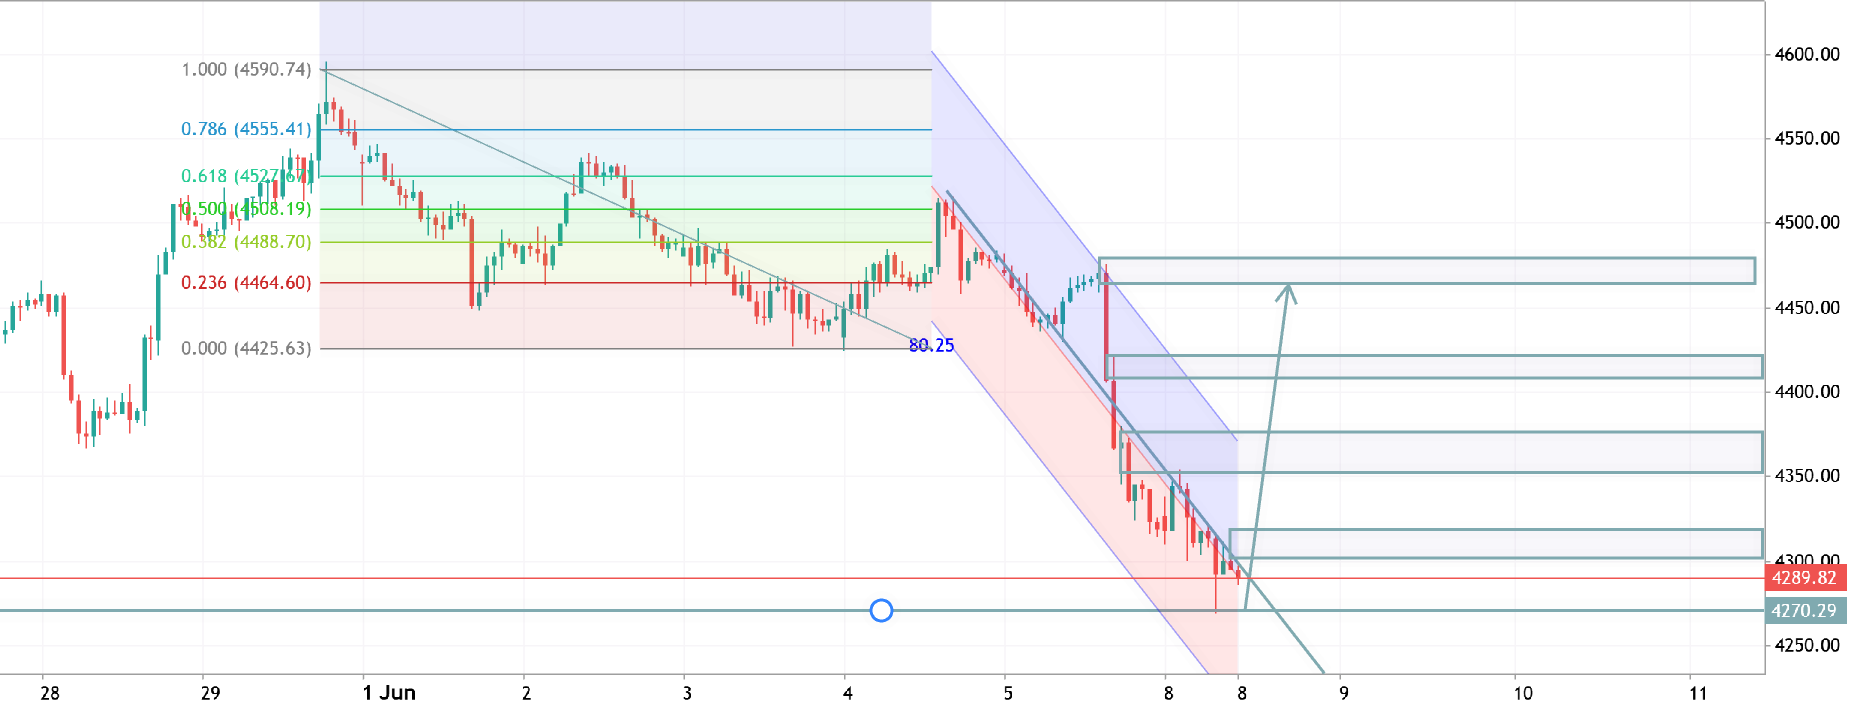
XAUUSD H1 ANALYSIS
XAUUSD Analysis (H1)
Gold remains under bearish pressure inside a descending channel, but price is approaching a key support zone where a short-term corrective rebound could develop. A breakout above the channel resistance may trigger a recovery toward the 4400–4450 area, while failure to hold current support could extend the downtrend.
Bias: Bearish below resistance, bullish correction possible from support. Key Levels: 🔹 Resistance: 4400 – 4450 🔹 Support: 4250 – 4280
Trade with proper risk management and wait for confirmation before entry.
2026.06.08 09:05 0 
GBPUSD H1 ANALYSIS
GBPUSD H1 Analysis GBPUSD is showing a potential bullish recovery after respecting a key demand zone. Price is forming a rounded bottom structure and holding above short-term support, suggesting buyers are regaining control. 📈 Bullish Scenario: A breakout above the current resistance zone could trigger momentum toward 1.3460 – 1.3480. 📉 Bearish Scenario: Failure to hold above 1.3400 may lead to another retest of lower support levels. Bias: Bullish while price remains above support. Watch for confirmation through a strong breakout candle.
2026.06.04 08:24 0 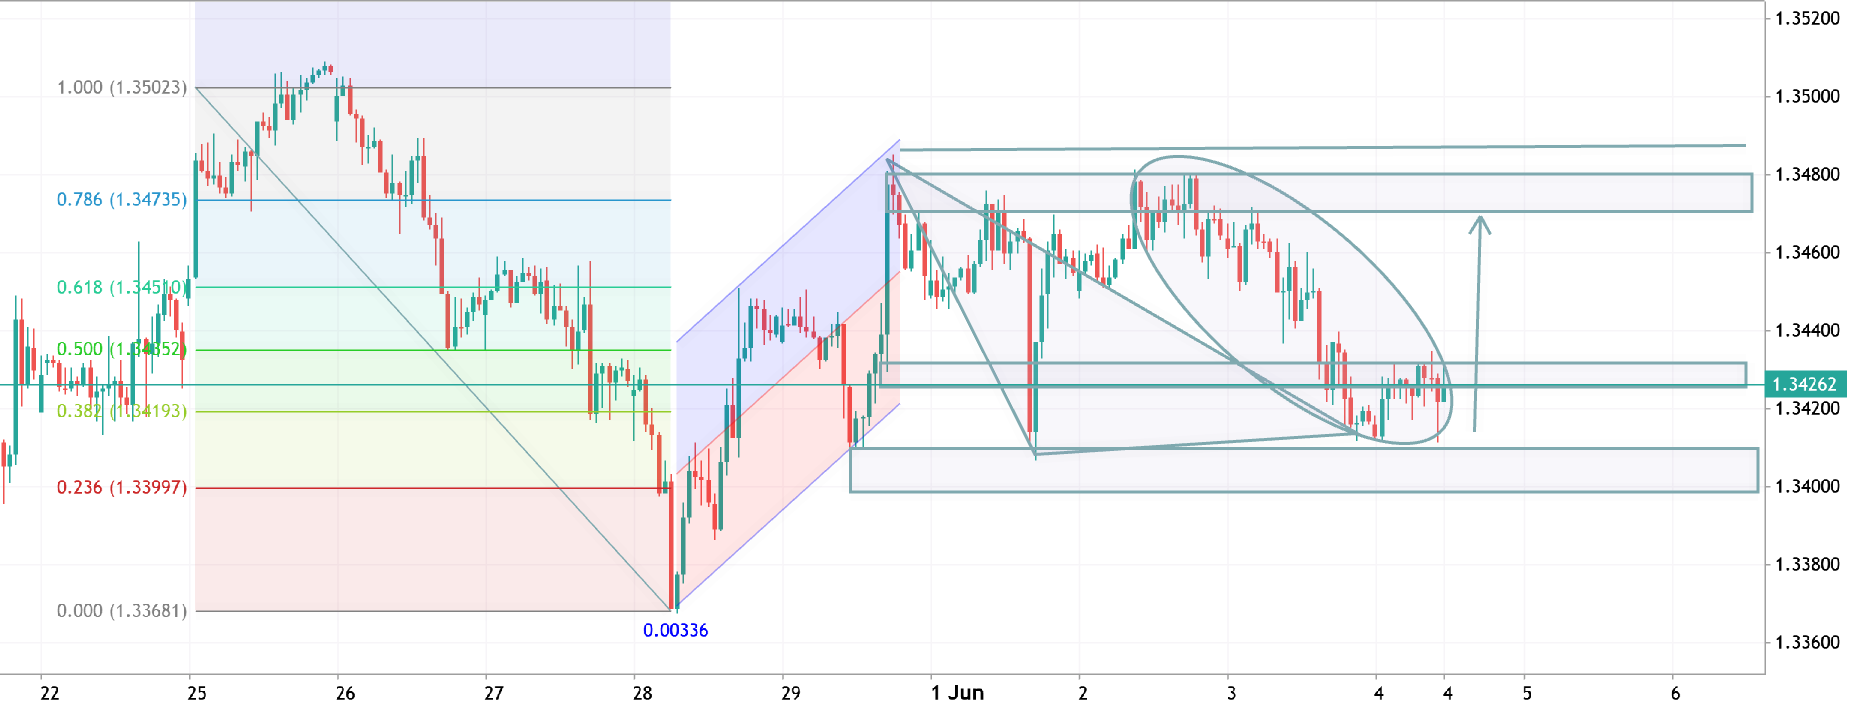
GBPUSD H1 ANALYSIS
GBPUSD H1 Analysis GBPUSD is showing a potential bullish recovery after respecting a key demand zone. Price is forming a rounded bottom structure and holding above short-term support, suggesting buyers are regaining control. 📈 Bullish Scenario: A breakout above the current resistance zone could trigger momentum toward 1.3460 – 1.3480. 📉 Bearish Scenario: Failure to hold above 1.3400 may lead to another retest of lower support levels. Bias: Bullish while price remains above support. Watch for confirmation through a strong breakout candle.
2026.06.04 08:23 0 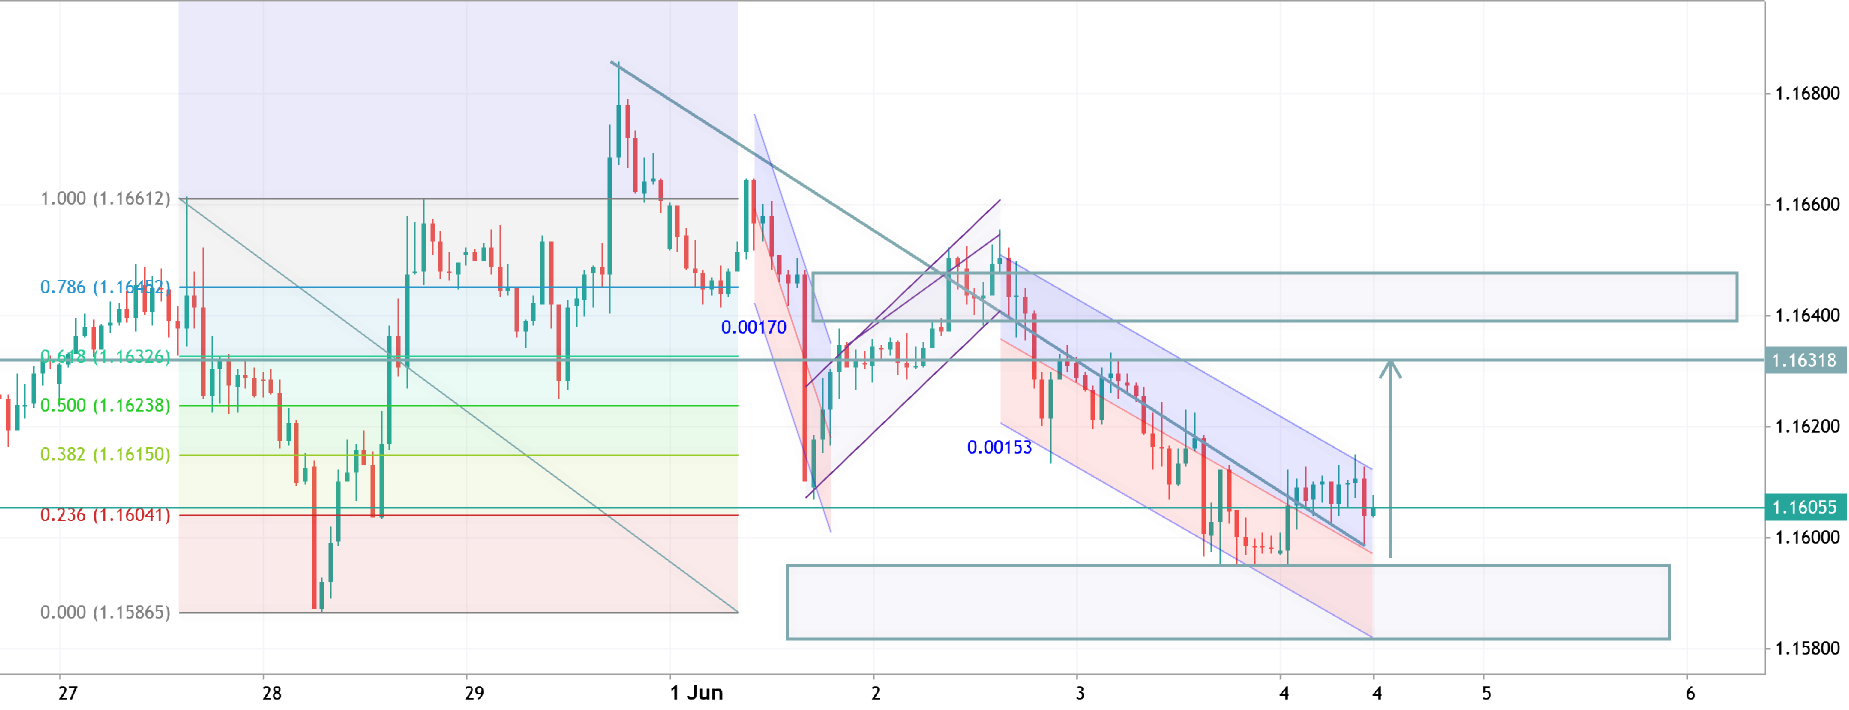
EURUSD H1 ANALTSIS
EURUSD | H1 Analysis EURUSD is trading inside a descending channel and showing signs of bullish recovery from the lower boundary. Buyers are attempting to regain control after a prolonged correction. 📈 Bullish Scenario: A breakout above the channel resistance could drive price toward the 1.1625 – 1.1645 supply zone. 📊 Key Levels: 🔹 Support: 1.1590 – 1.1600 🔹 Resistance: 1.1625 – 1.1645 Outlook: Price is testing a critical breakout area. Holding above recent lows keeps the bullish bias intact, with upside targets remaining in focus. 🚀📉 #EURUSD #Forex #TechnicalAnalysis
2026.06.04 08:14 0 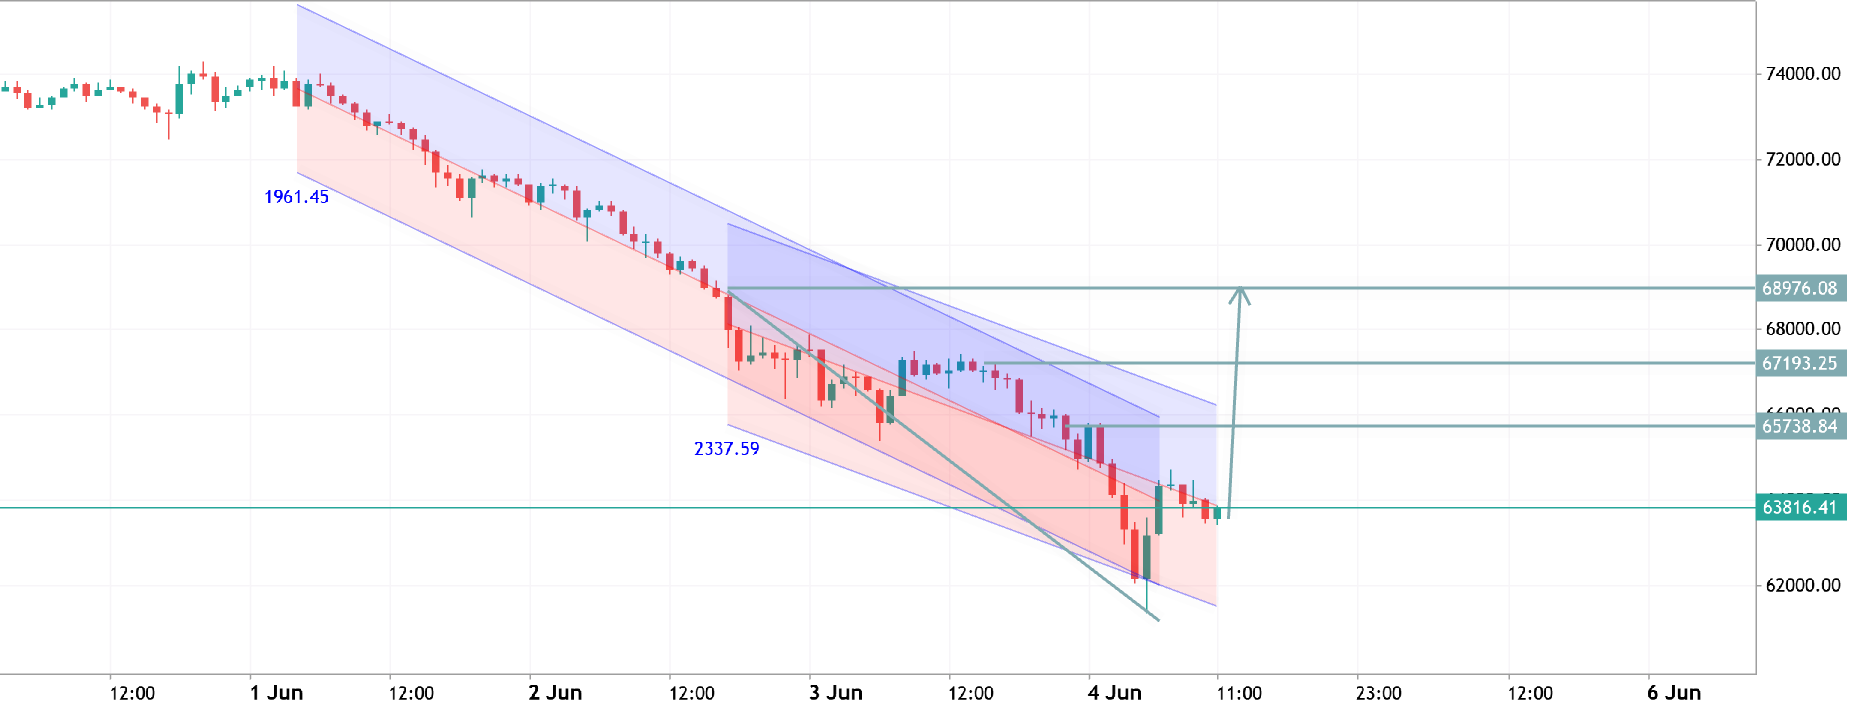
BTCUSD H1 ANALYSIS
BTCUSD | H1 Analysis BTC is approaching a key breakout zone after a prolonged bearish channel decline. Price is holding above recent lows and attempting to build bullish momentum. 📈 Bullish Setup: A confirmed breakout above channel resistance could trigger a move toward 67.2K – 69.0K. 📊 Key Levels: Support: 63.3K – 63.8K
Resistance: 67.2K – 69.0K Outlook: Momentum is shifting in favor of buyers. A clean breakout and hold above resistance may accelerate the recovery toward higher targets. 🚀📊
2026.06.04 08:07 0 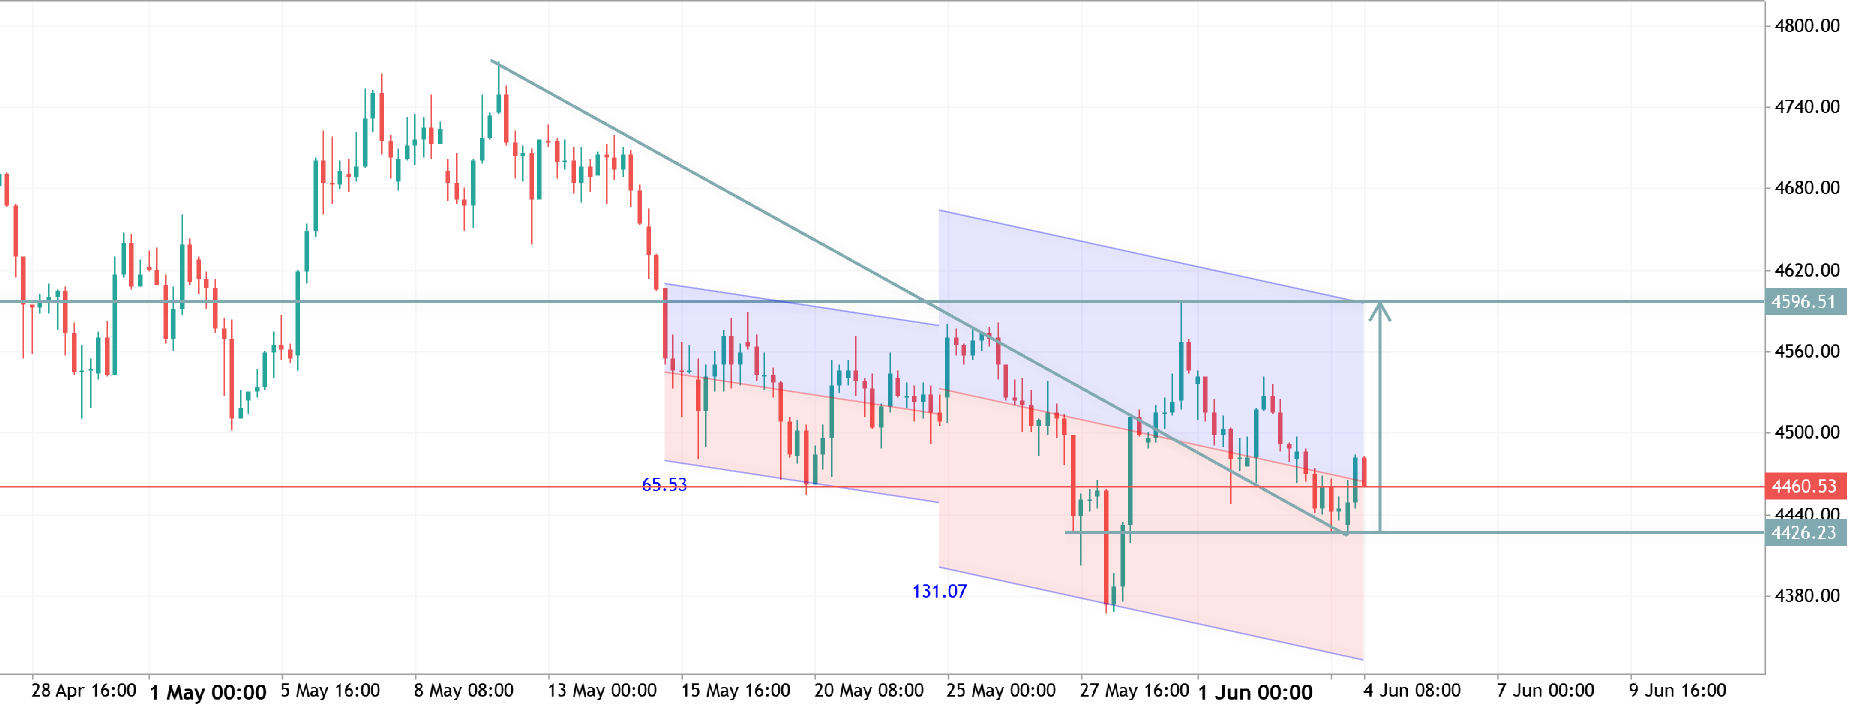
xauusd h4 analysis
XAUUSD | H4 Analysis Gold is showing a strong bullish breakout from a descending channel pattern. Price has successfully rejected support around 4440–4460 and is now pushing higher toward the upper resistance zone. 📈 Bullish Scenario: A sustained move above 4500 could open the path toward 4560–4600. 📊 Key Levels: Support: 4440 – 4460
Resistance: 4560 – 4600 Outlook: Buyers remain in control while price holds above the breakout area. Momentum favors further upside continuation. 🚀
2026.06.04 08:00 15 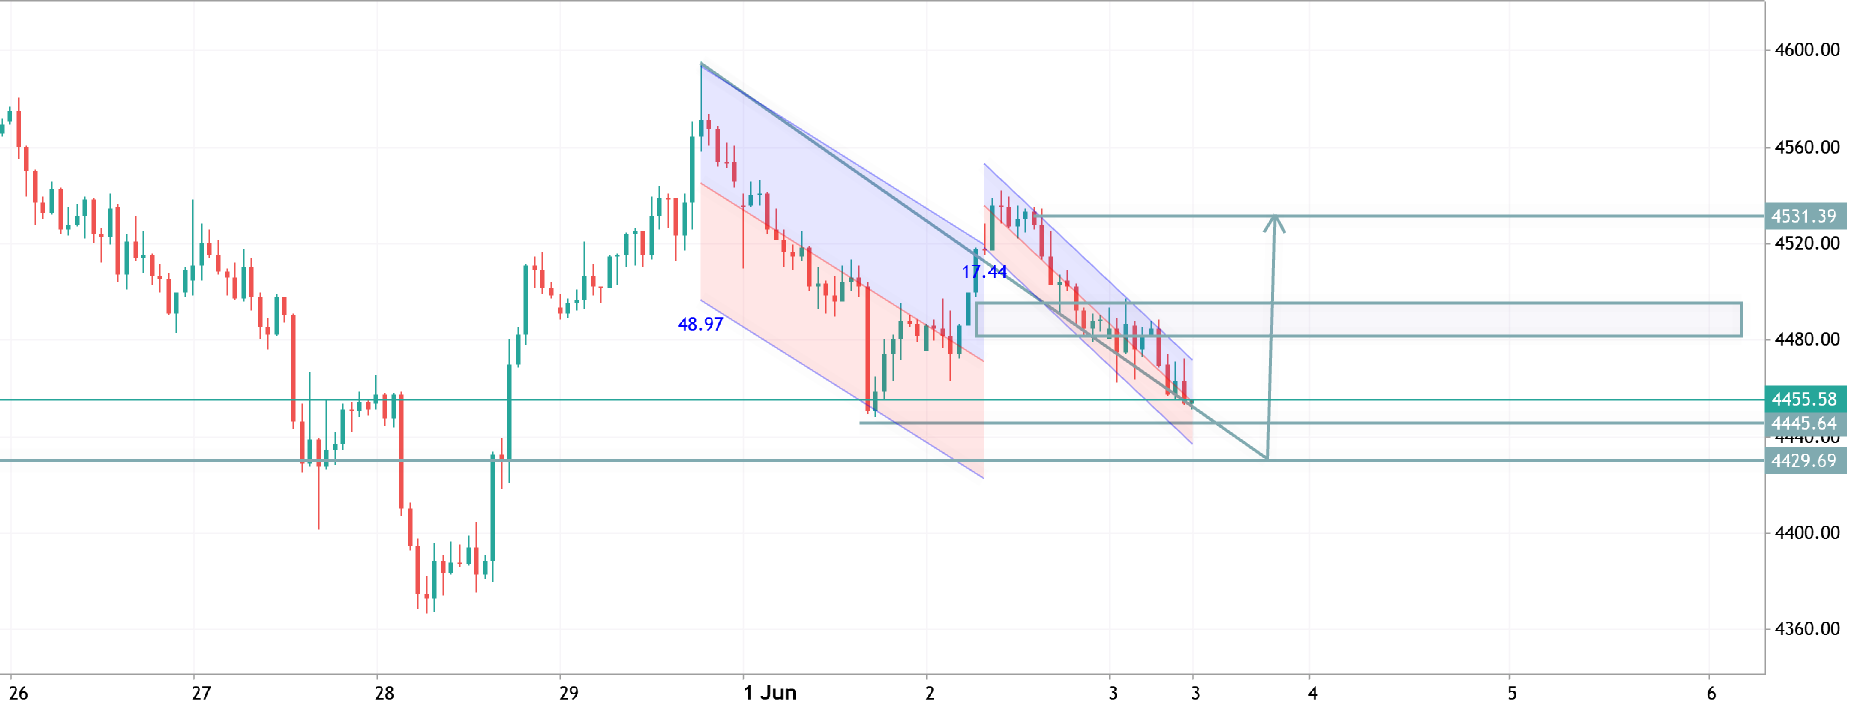
XAUUSD H1 ANALYSIS
XAUUSD H1 Analysis
Gold is trading inside a descending channel and has reached a key demand zone around 4430–4440. Price action suggests bearish momentum is weakening, with a potential bullish breakout forming.
📈 Bullish Scenario: A break above the channel resistance could trigger a move toward 4485, followed by 4530 as the next major target.
📉 Bearish Scenario: Failure to hold above the support zone may extend the decline toward lower liquidity levels.
Bias: Cautiously Bullish while price remains above support. Watch for confirmation before entry.
#XAUUSD #Gold #Forex #TechnicalAnalysis #MQL5 #TradingView
2026.06.03 08:11 0 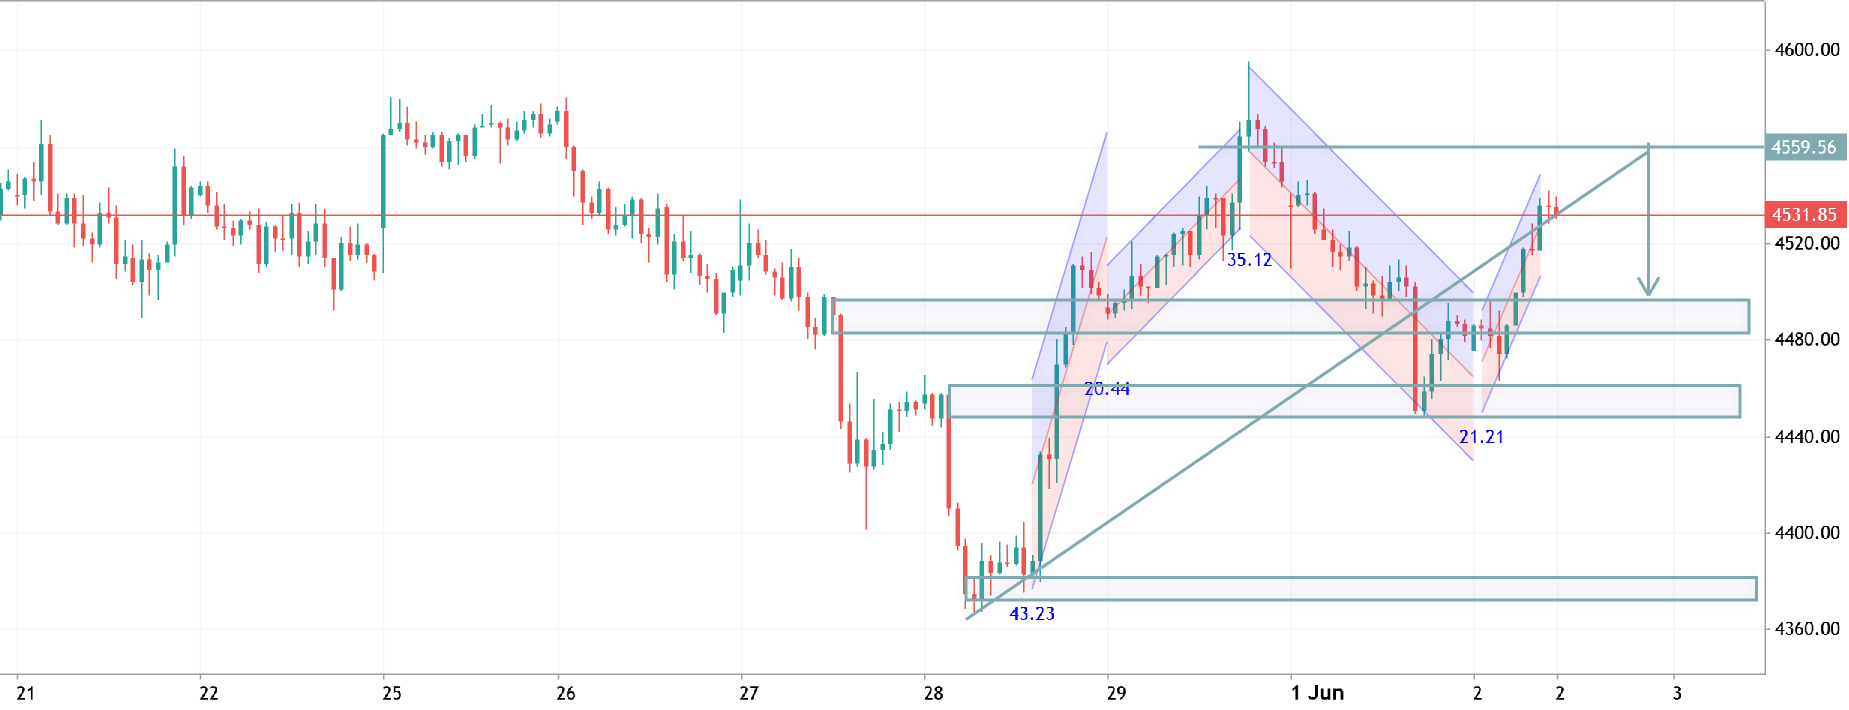
XAUUSD H1 ANALYSIS
XAUUSD H1 Analysis
Gold is testing a major resistance zone around 4550-4560 after a strong bullish recovery from support. Price remains inside an ascending structure, but a bearish harmonic completion near resistance suggests a possible rejection.
📌 Key Levels:
Resistance: 4559
Support: 4480 / 4440
🔍 Outlook: A rejection from 4559 could trigger a pullback toward 4480. However, a clean breakout above resistance may extend the bullish move to new highs.
Trade Smart: Watch for confirmation at resistance before entering. #XAUUSD #Gold #Forex #TechnicalAnalysis #MQL5
2026.06.02 08:29 0 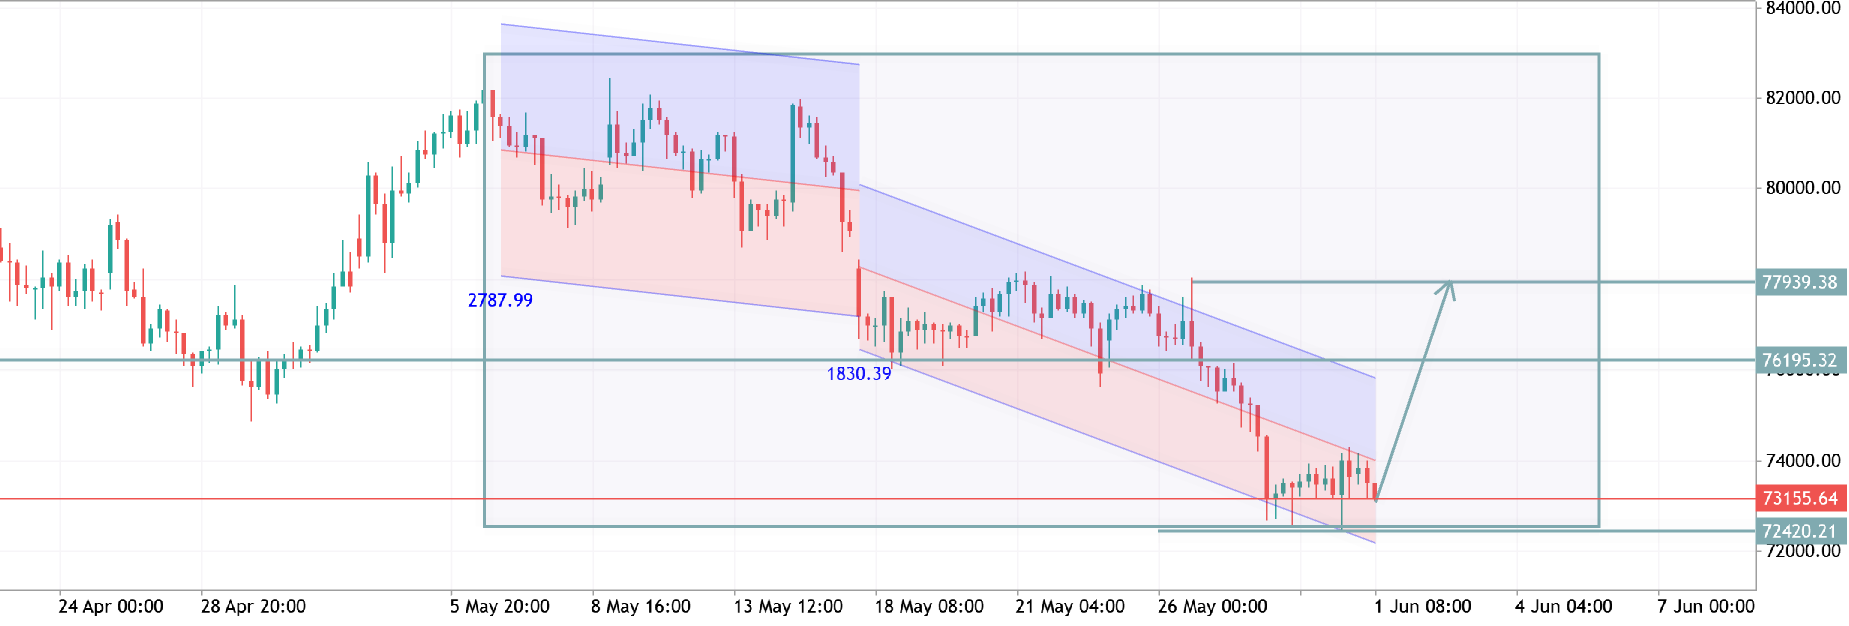
BTCUSD H4 ANALYSIS
BTCUSD | H4 Analysis
Bitcoin is showing signs of accumulation near a major support zone after an extended bearish channel. Price is testing the lower trendline, and a breakout from the current structure could trigger a strong bullish recovery toward 76,000 – 78,000.
📈 Bullish Scenario: Sustained buying above support may push BTC toward higher resistance levels and confirm trend reversal.
📉 Bearish Scenario: Failure to hold support could extend the correction before the next bullish leg develops.
Bias: Bullish while support holds. Watch for breakout confirmation before targeting upper resistance zones.
#BTCUSD #Bitcoin #Crypto #TechnicalAnalysis #MQL5 #TradingView
2026.06.01 06:29 5