 BTCUSD Short Bitcoin vs US Dollar
 BTCUSD TRADE IDEA
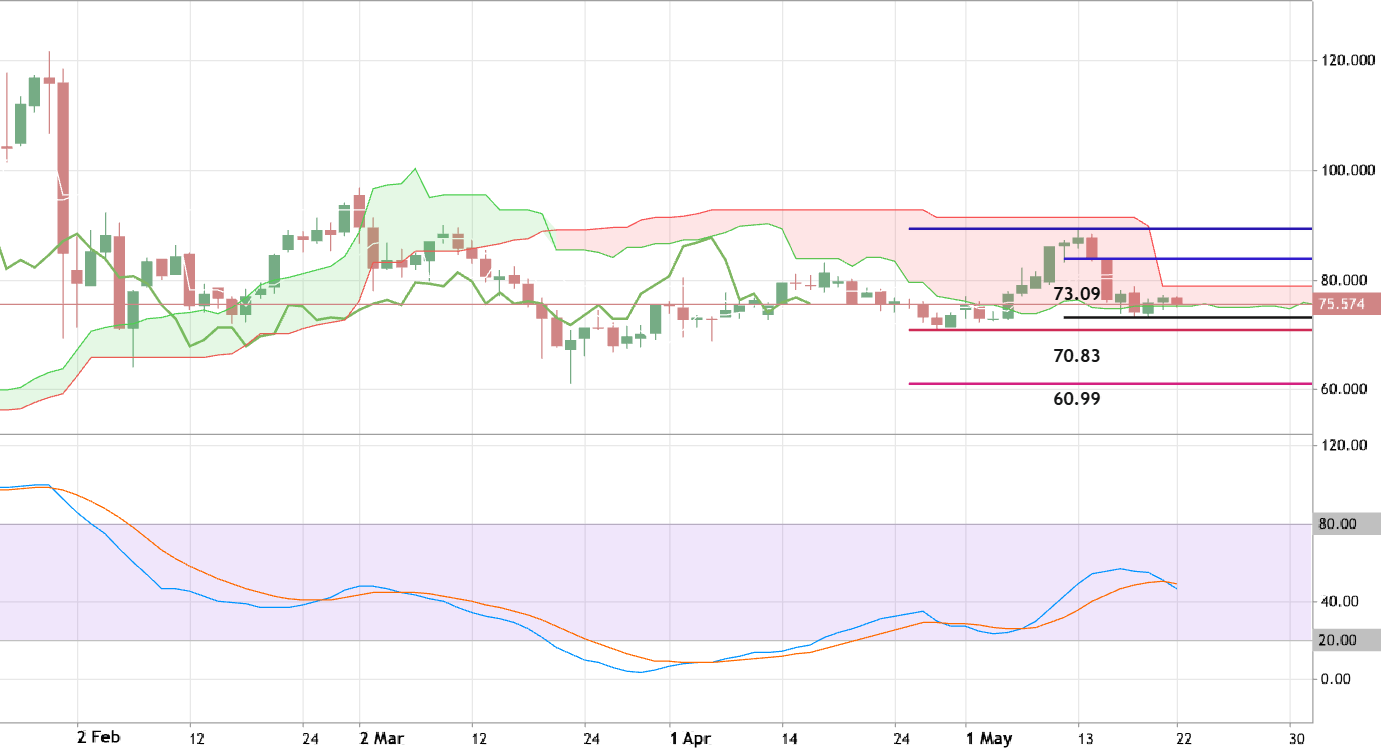
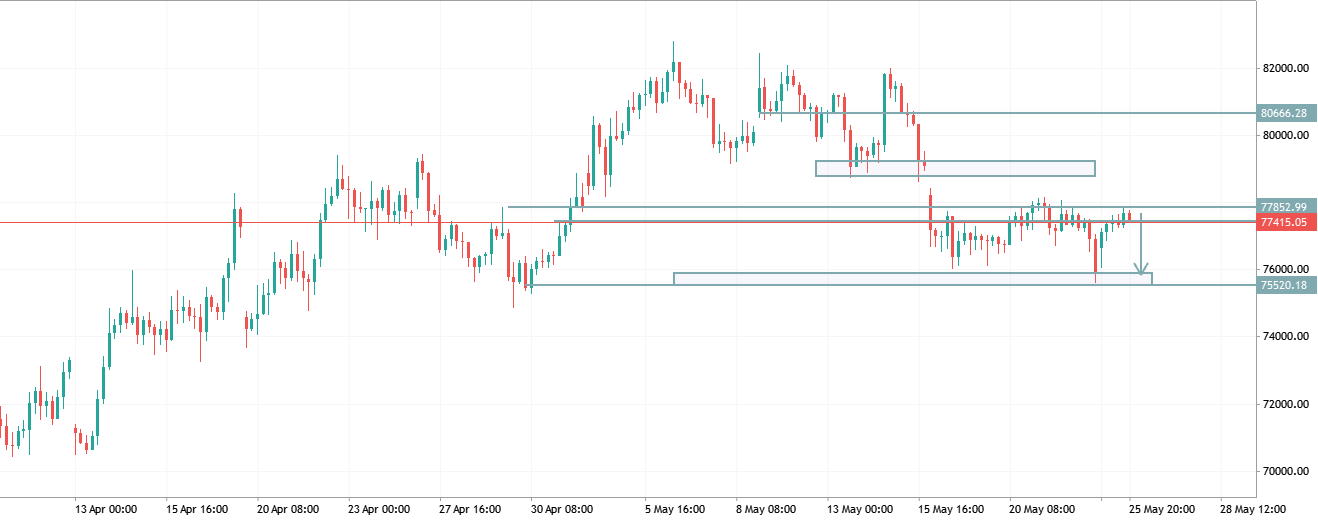
BTCUSD is currently trading inside a short-term consolidation range after a strong bearish correction from the 81K resistance zone. Price reacted sharply from the supply area near 79,000–80,000 and dropped toward the key support around 75,500. The market structure on H4 remains bearish-to-neutral while price stays below the 77,850 resistance zone. Multiple rejections from this level show weak bullish momentum and possible continuation to the downside. Key Levels: Resistance: 77,850 → 80,600 Support: 75,500 Bearish Scenario: If BTCUSD fails to break and close above 77,850, sellers may push price back toward 75,500 support. A breakdown below 75,500 could open the path toward 74,000 and lower. Bullish Scenario: A strong H4 close above 77,850 may trigger recovery momentum toward 79,000 and
0